Roadlines: The Long-Haul Trucking Ecosystem
Through an ethnography-led Design process, Roadlines summarizes a project where we explored opportunities for digital service design, to create driver-first offerings for all stakeholders in the ecosystem i.e. driver, fleet operator and the owner.
“If they roads are the veins of the country, we are the blood.”
- A verbatim quote from a driver during the country-wide ethnographic research
The Business Case
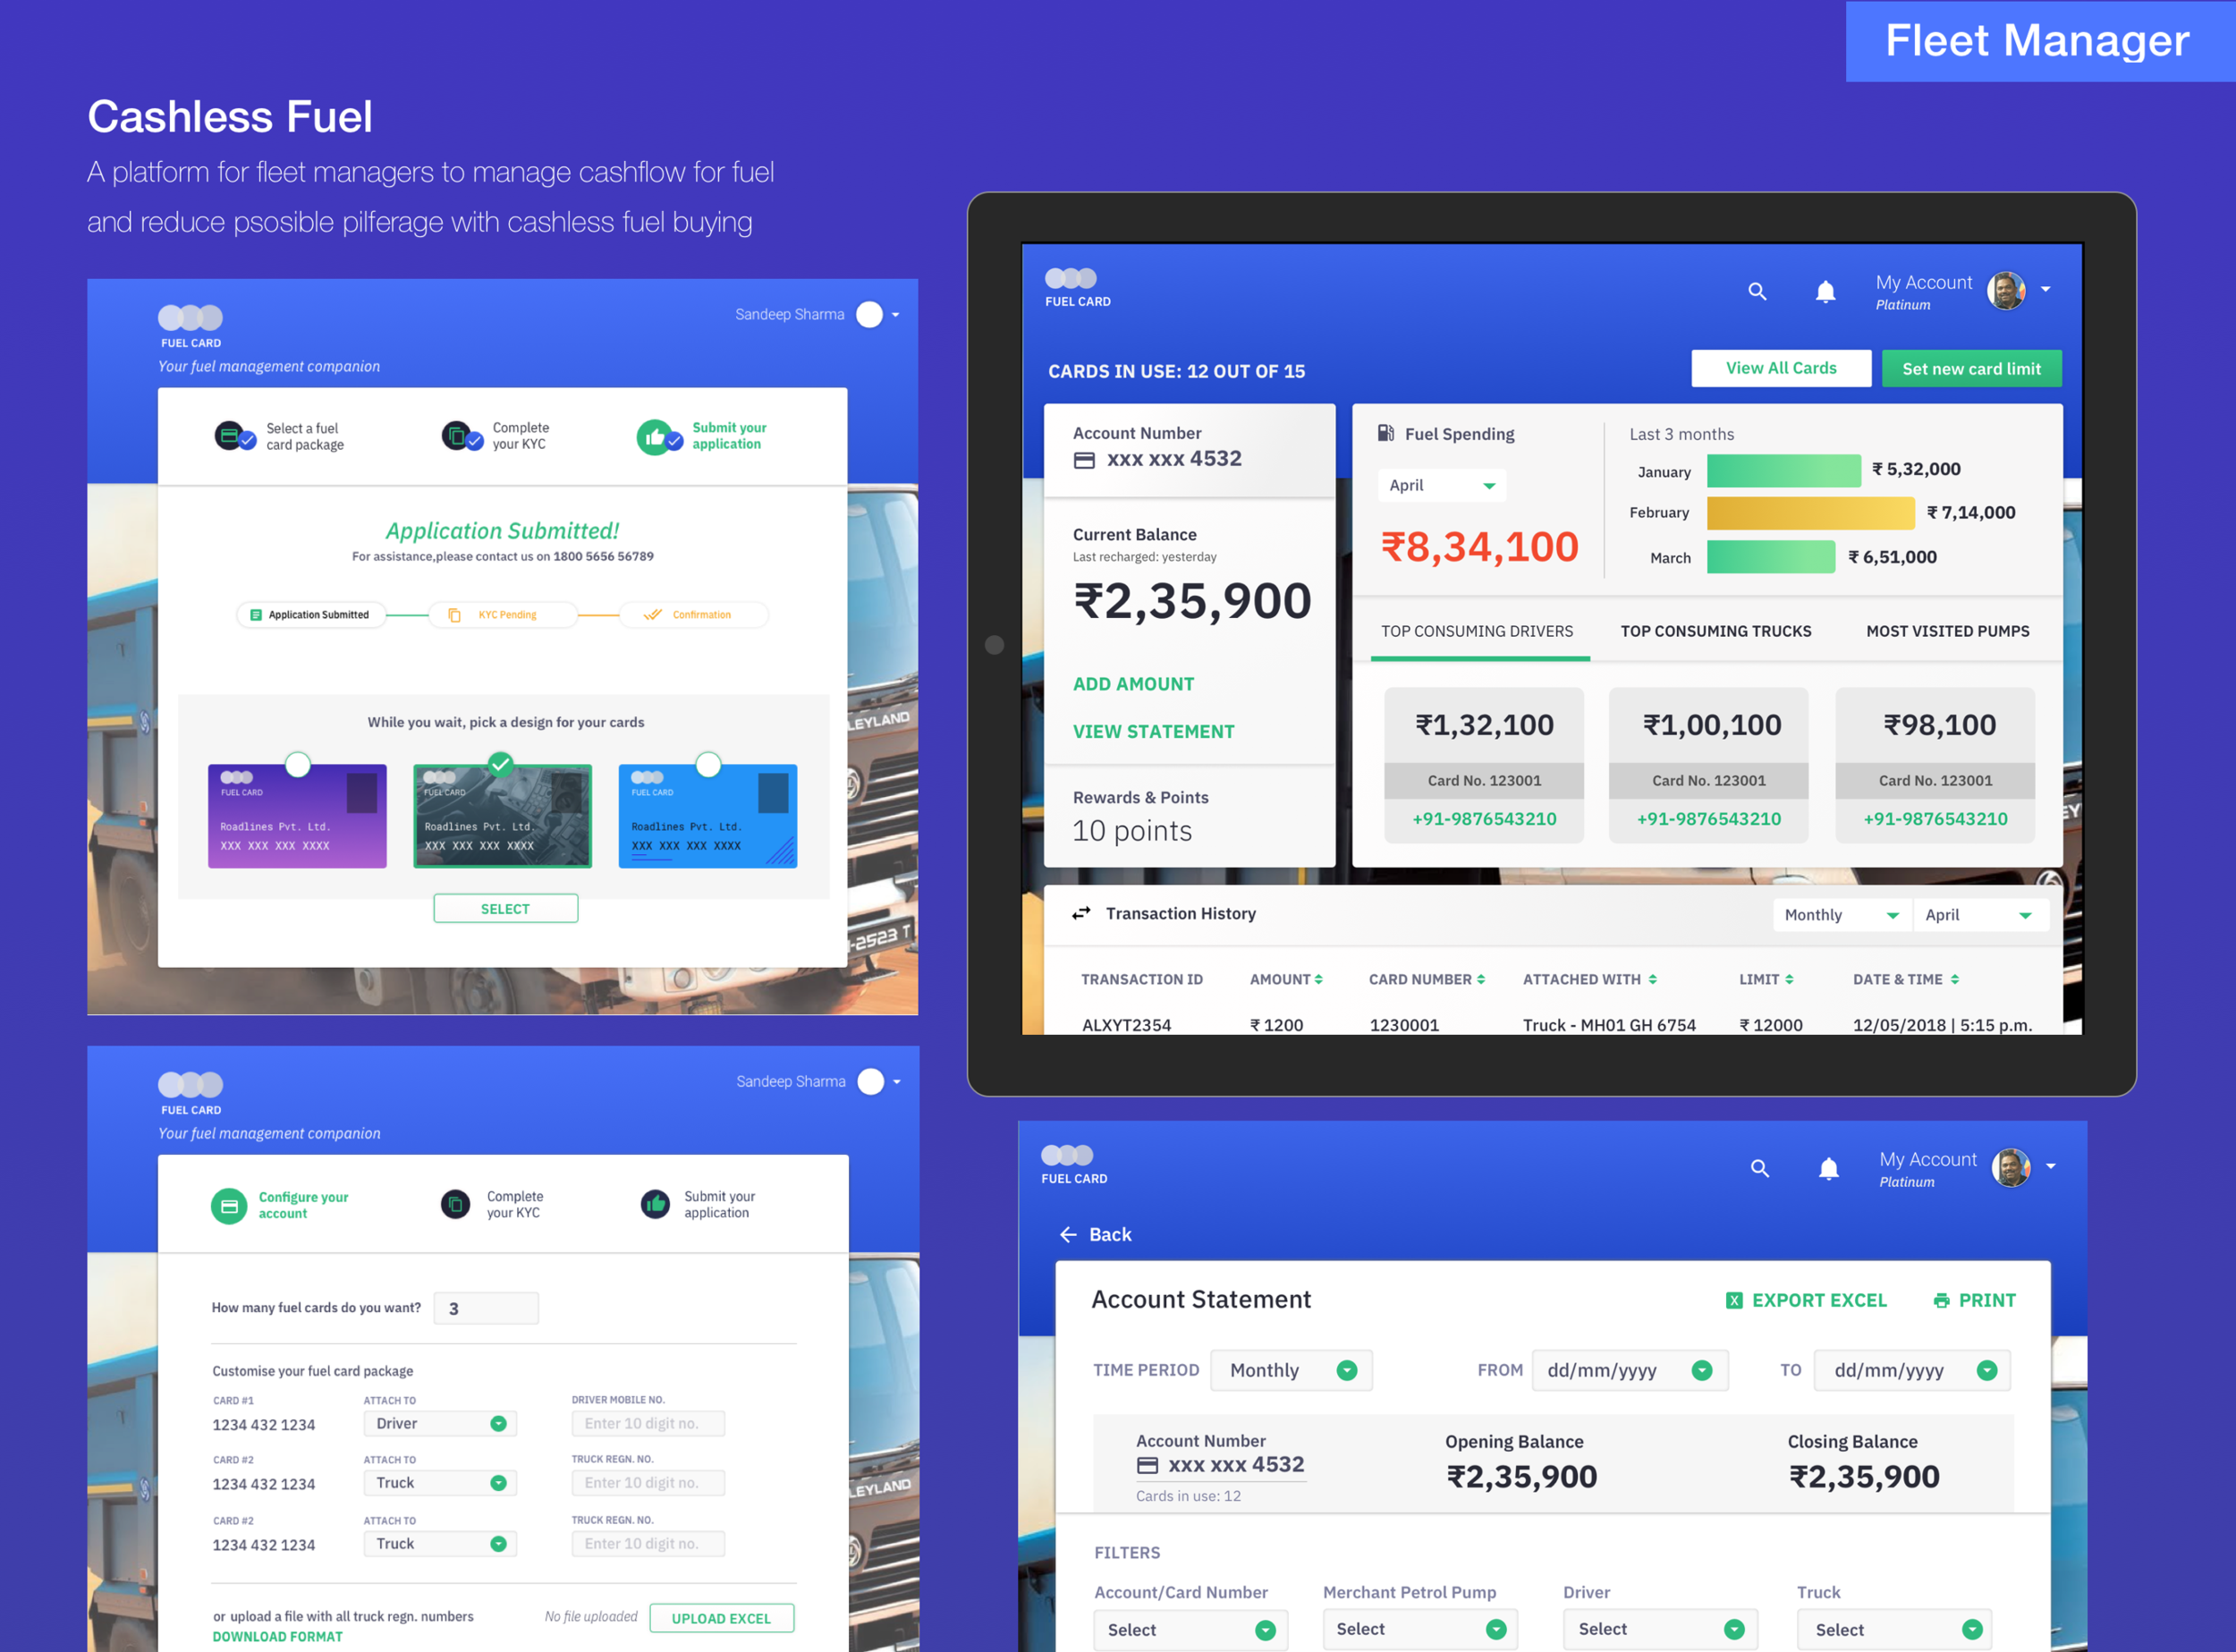
A leading automobile OEM company wanted to aid the fleets that used their trucks with fleet management and aim towards truck cost optimisation. Two key goals within this problem space to optimise fuel by promoting better driving habits and find better ways of manage fuel pilferage.
Project Statement
How might we design digital and service touchpoints for a disorganized ecosystem to drive better incentives for drivers who spend most of their time on roads, to keep check on fuel consumption, pilferage and vehicle health.
Research Objective
Map the key stakeholders in the Indian long-haul trucking industry and recognize levers to influence driver behavior change and through better & informed driver & fleet management, to improve profitability.
Project Details
Duration — 3 months
Completed — June 2018
Type — Industry Project
My Role
User Research and Insights Synthesis
UX Design
Wire-framing & User Testing
High fidelity Prototyping
Key Words
Ethnographic Research
Logistics and Supply Chain
Minimum Viable Product
UX Design
Team Members
Design Director and Research Lead (undisclosed)
Sanika Sahasrabuddhe (User Researcher and UX Designer)
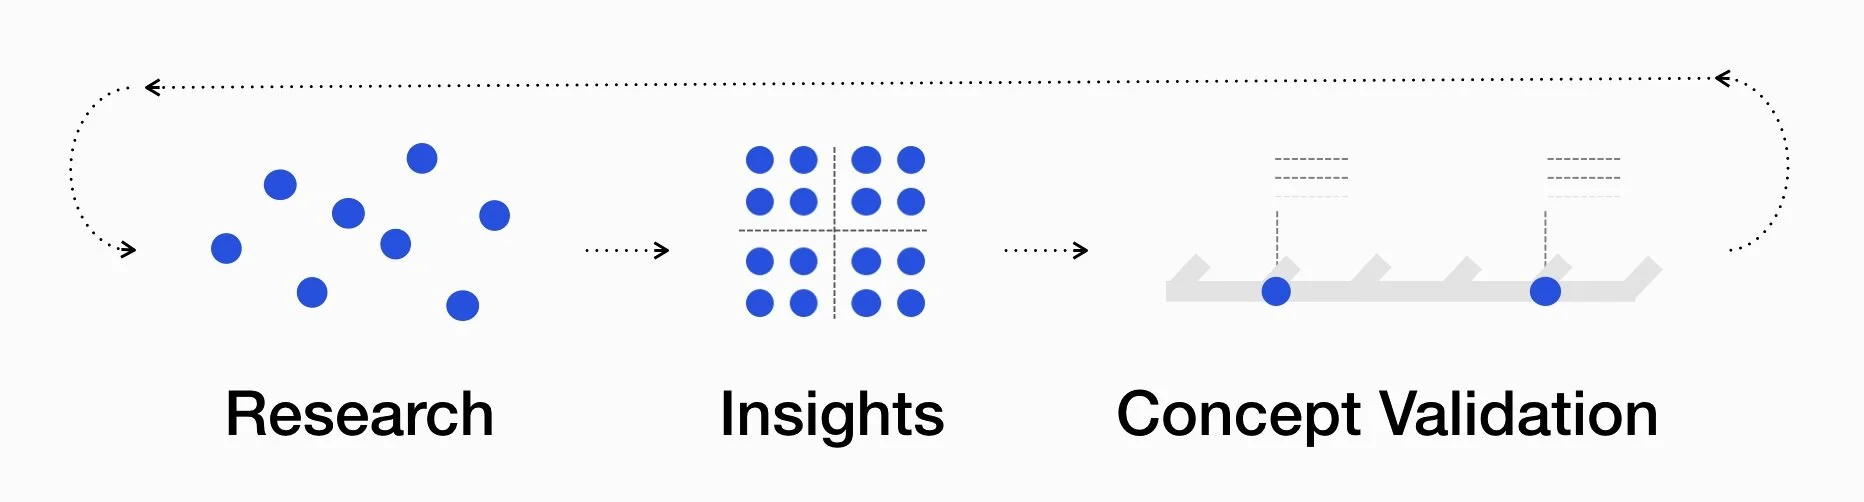
The Design Process
Insights from ethnography research methods were used to inform design concepts and the different design approaches were validated with stakeholders during contextual inquiry sessions.

Stages of the Project
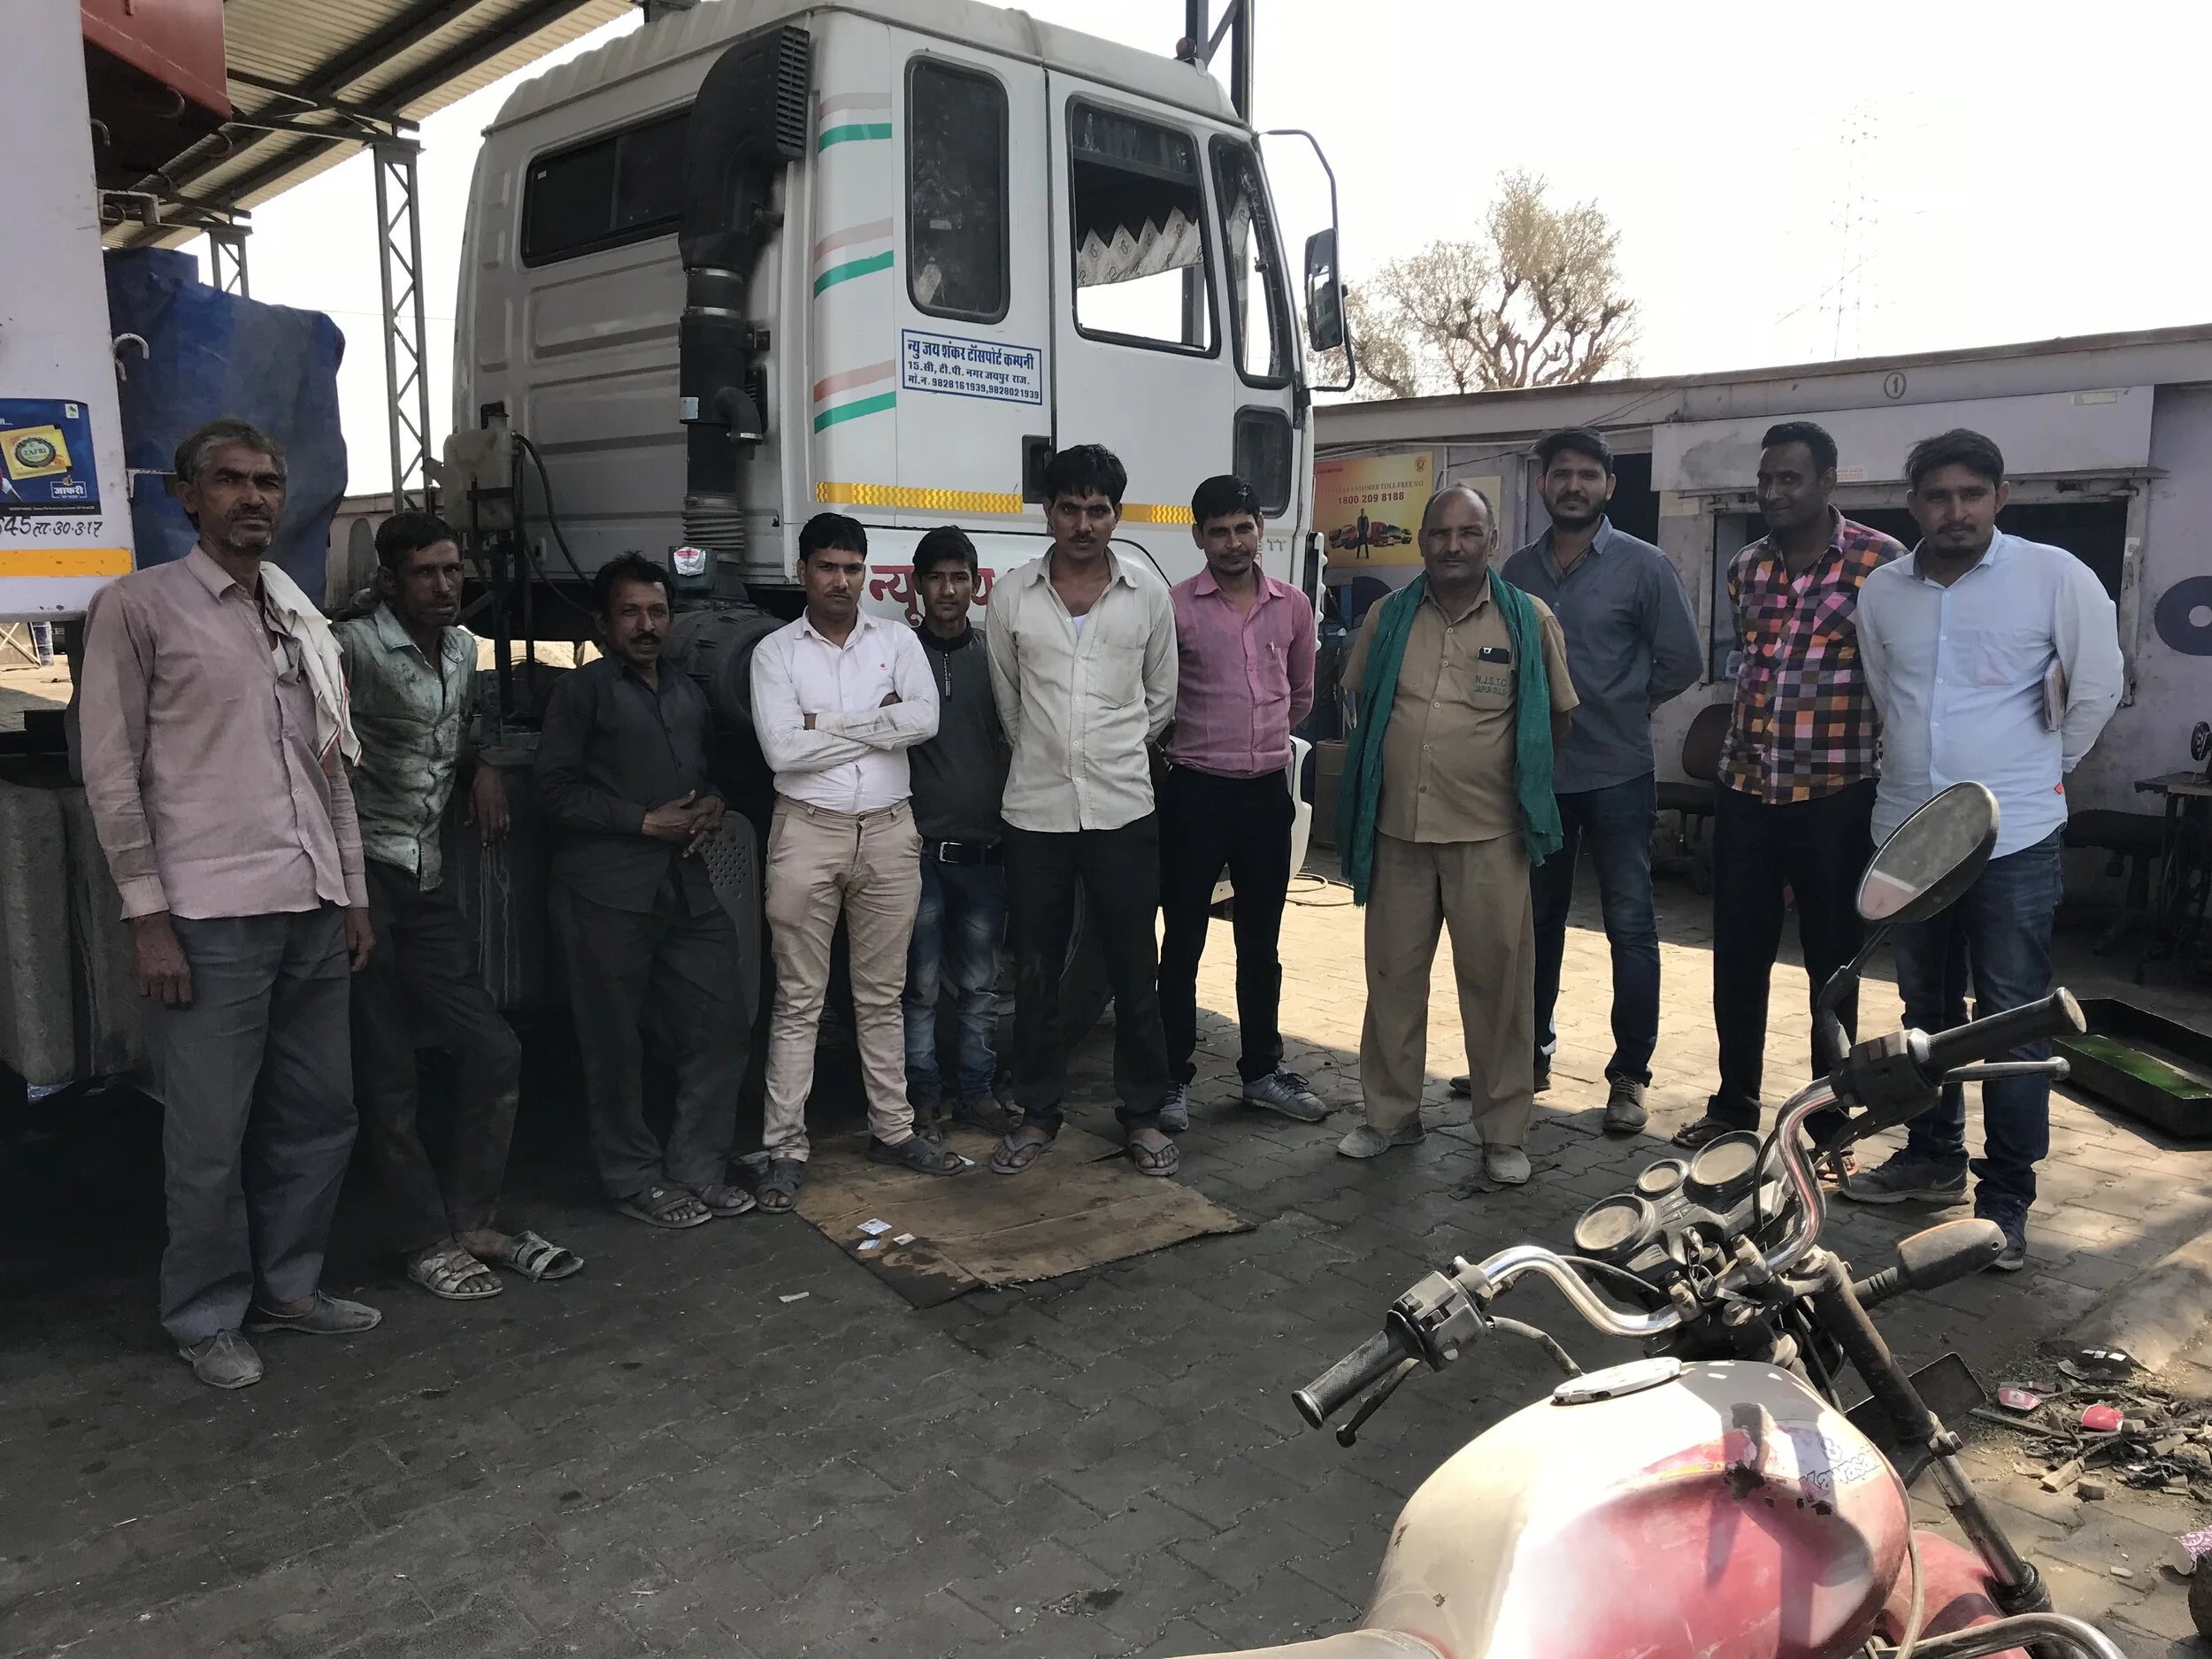
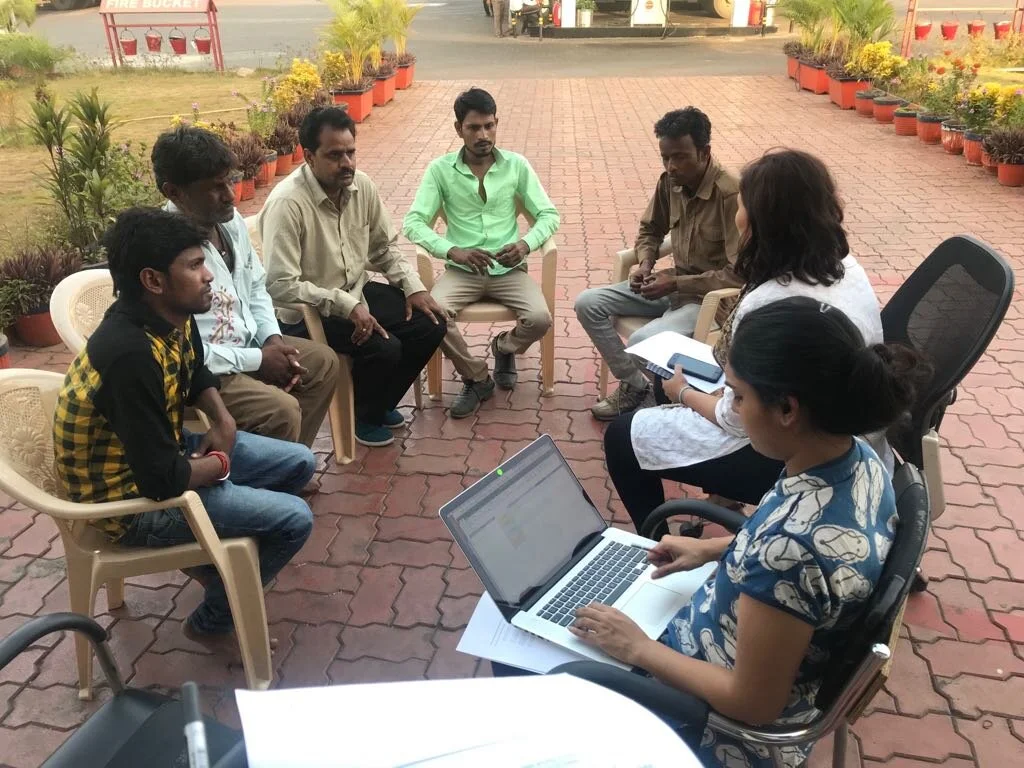
ETHNOGRAPHIC RESEARCH
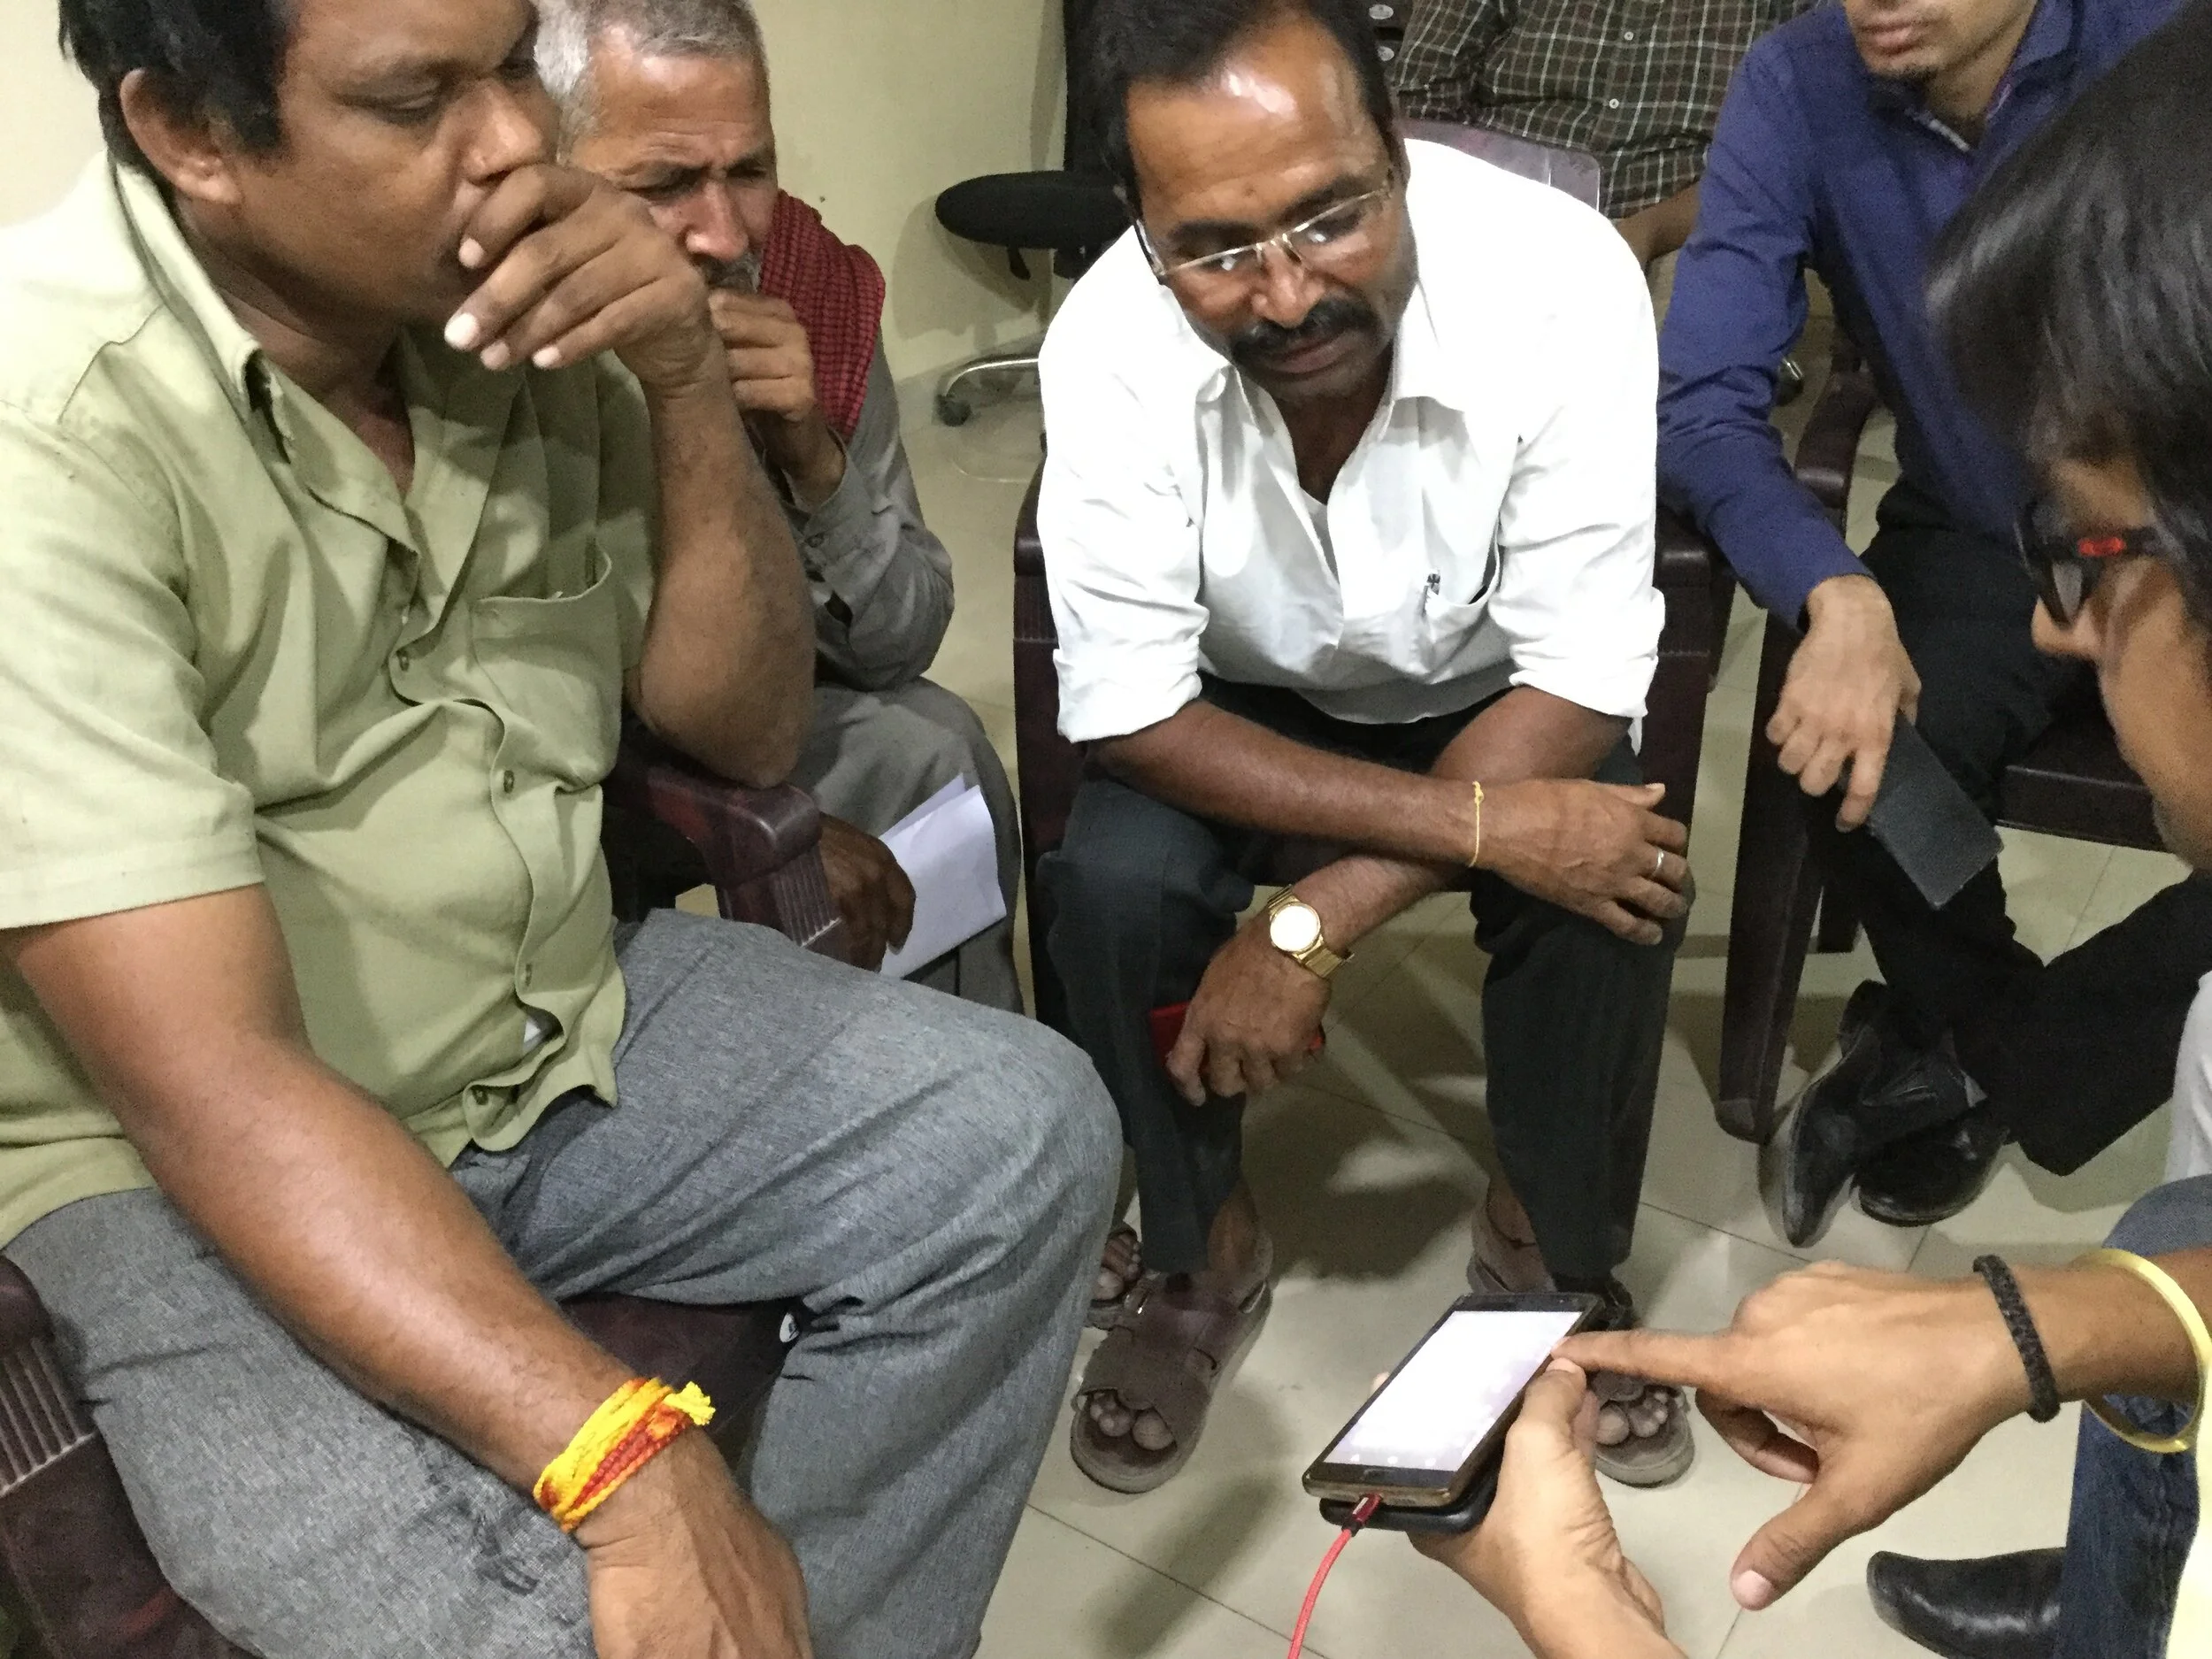
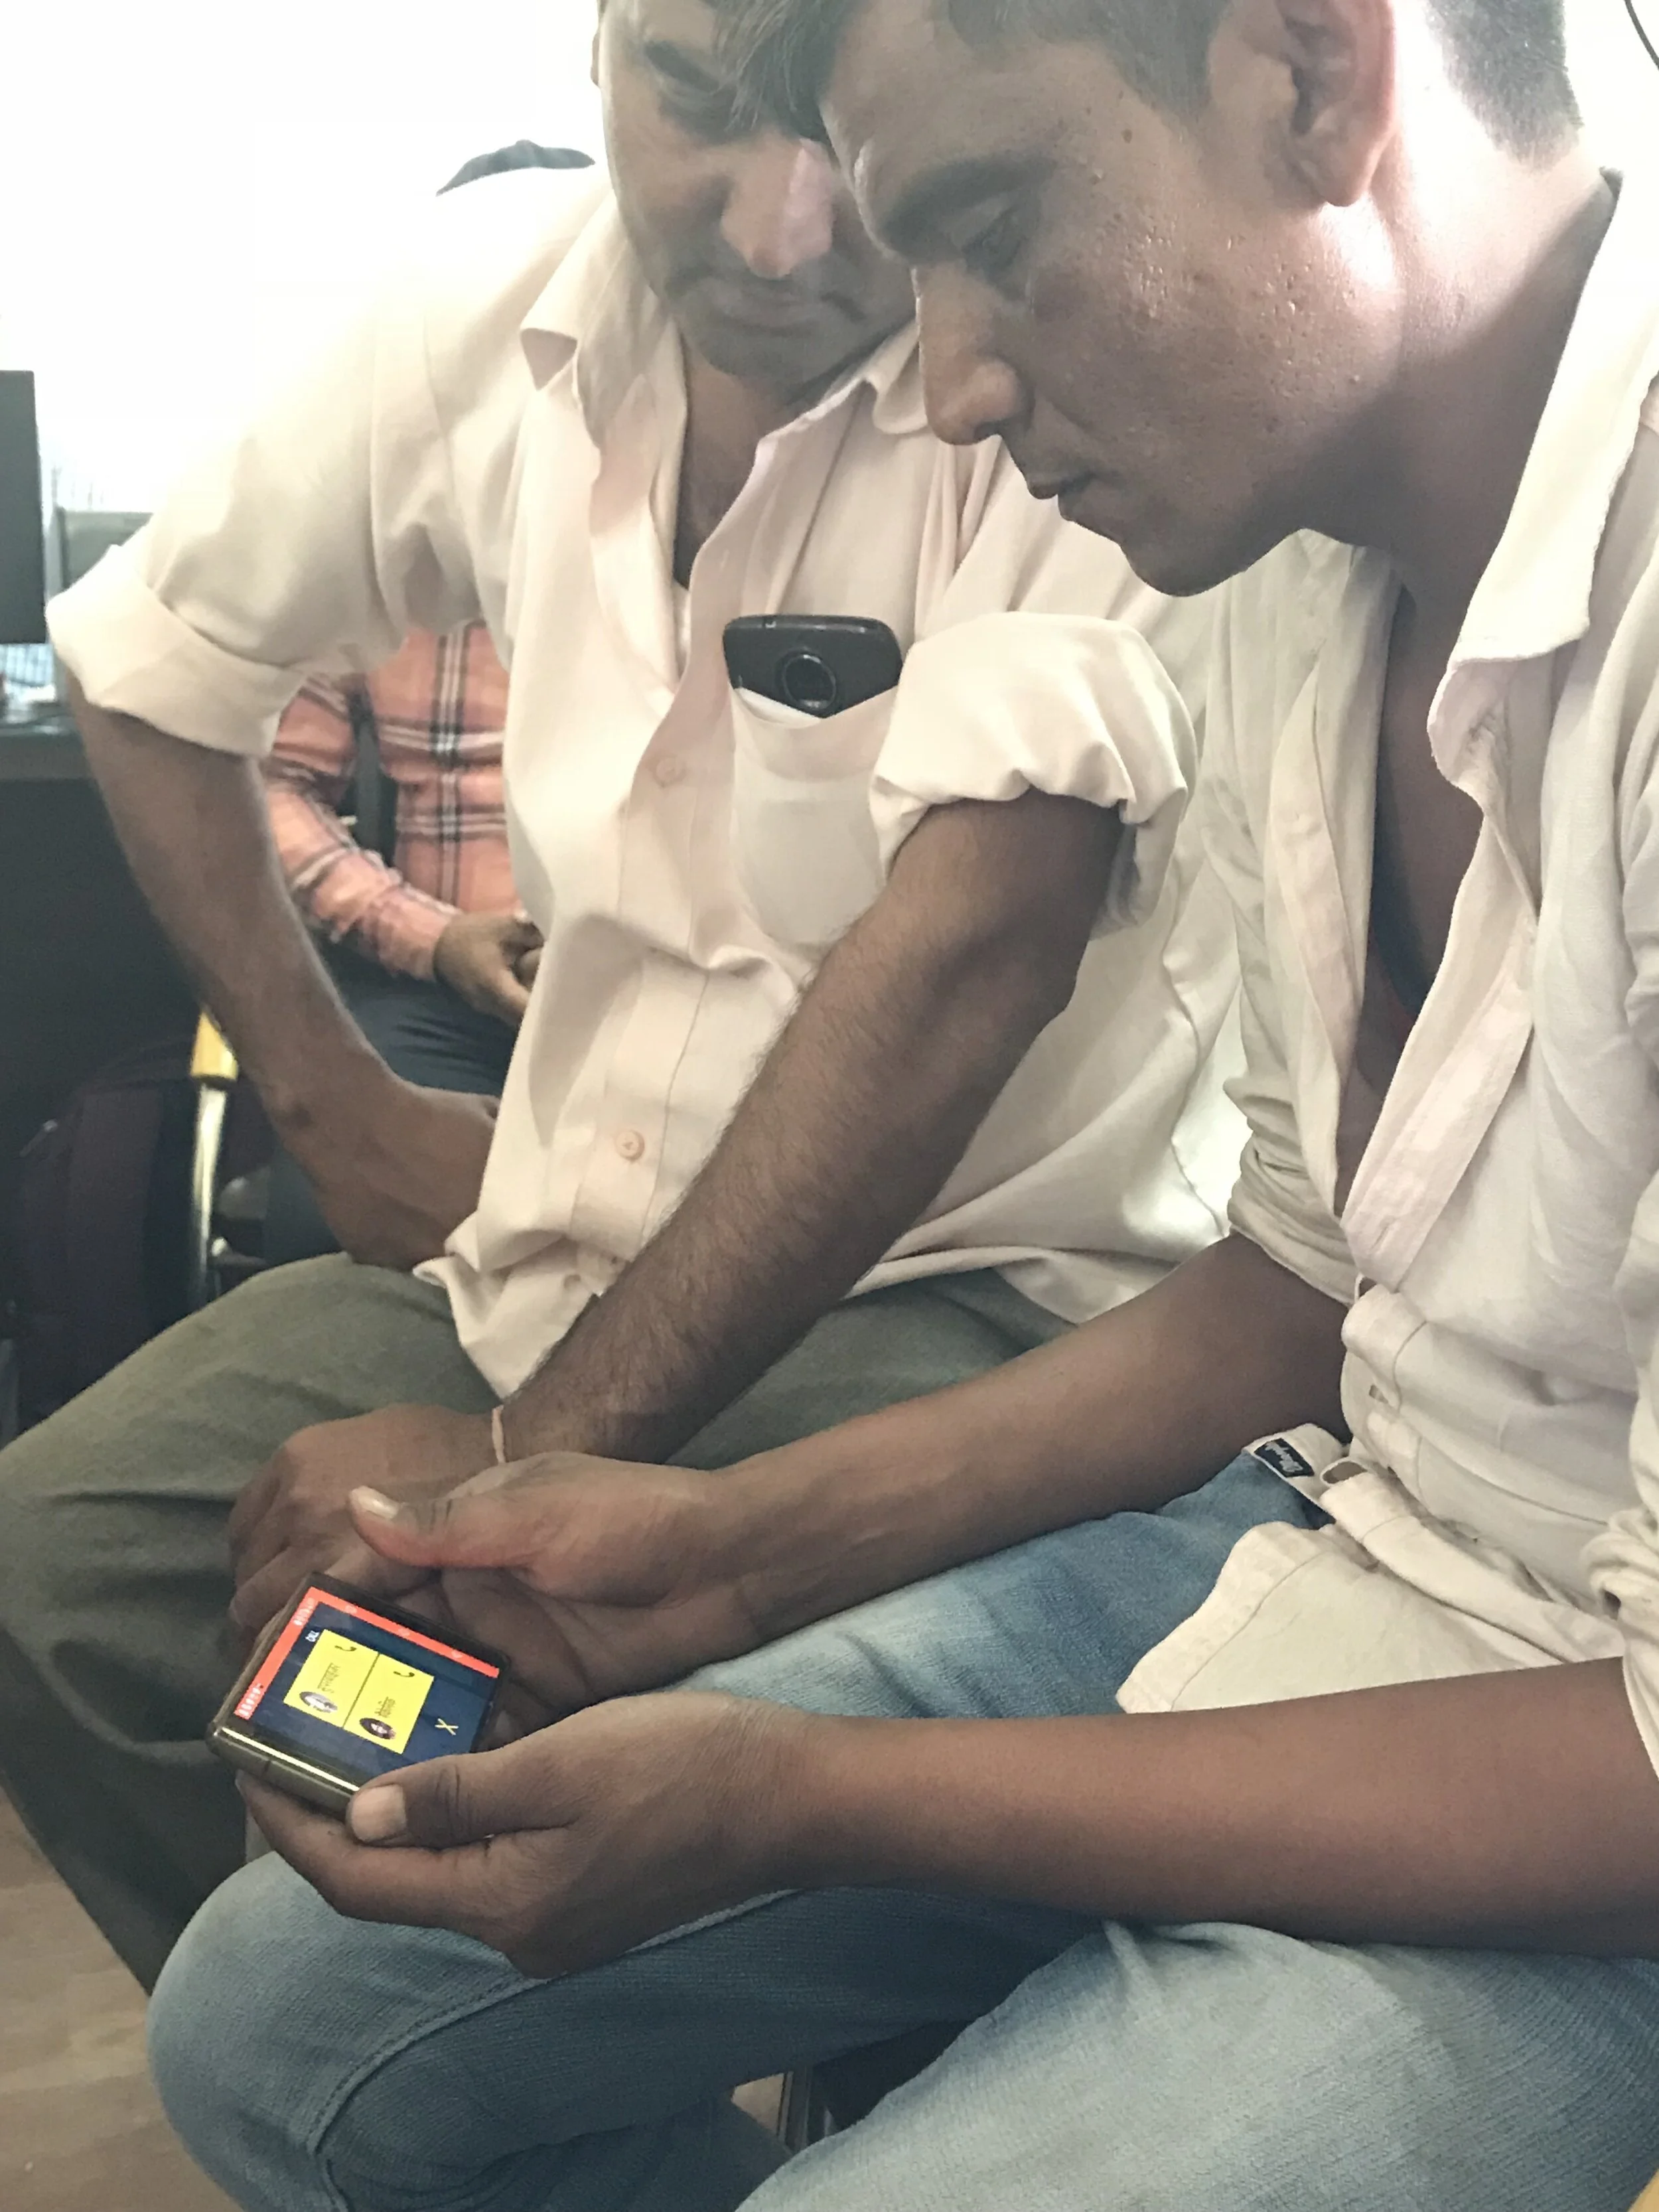
Research was conducted with key stakeholders: drivers, fleet managers and fleet owners using contextual inquiry.
We observed users in their environment to understand their activities, what tools are used in daily work and how they interact with these tools.
This framework helped to informed our analysis and made the ethnography richer
than only in-depth interviews.

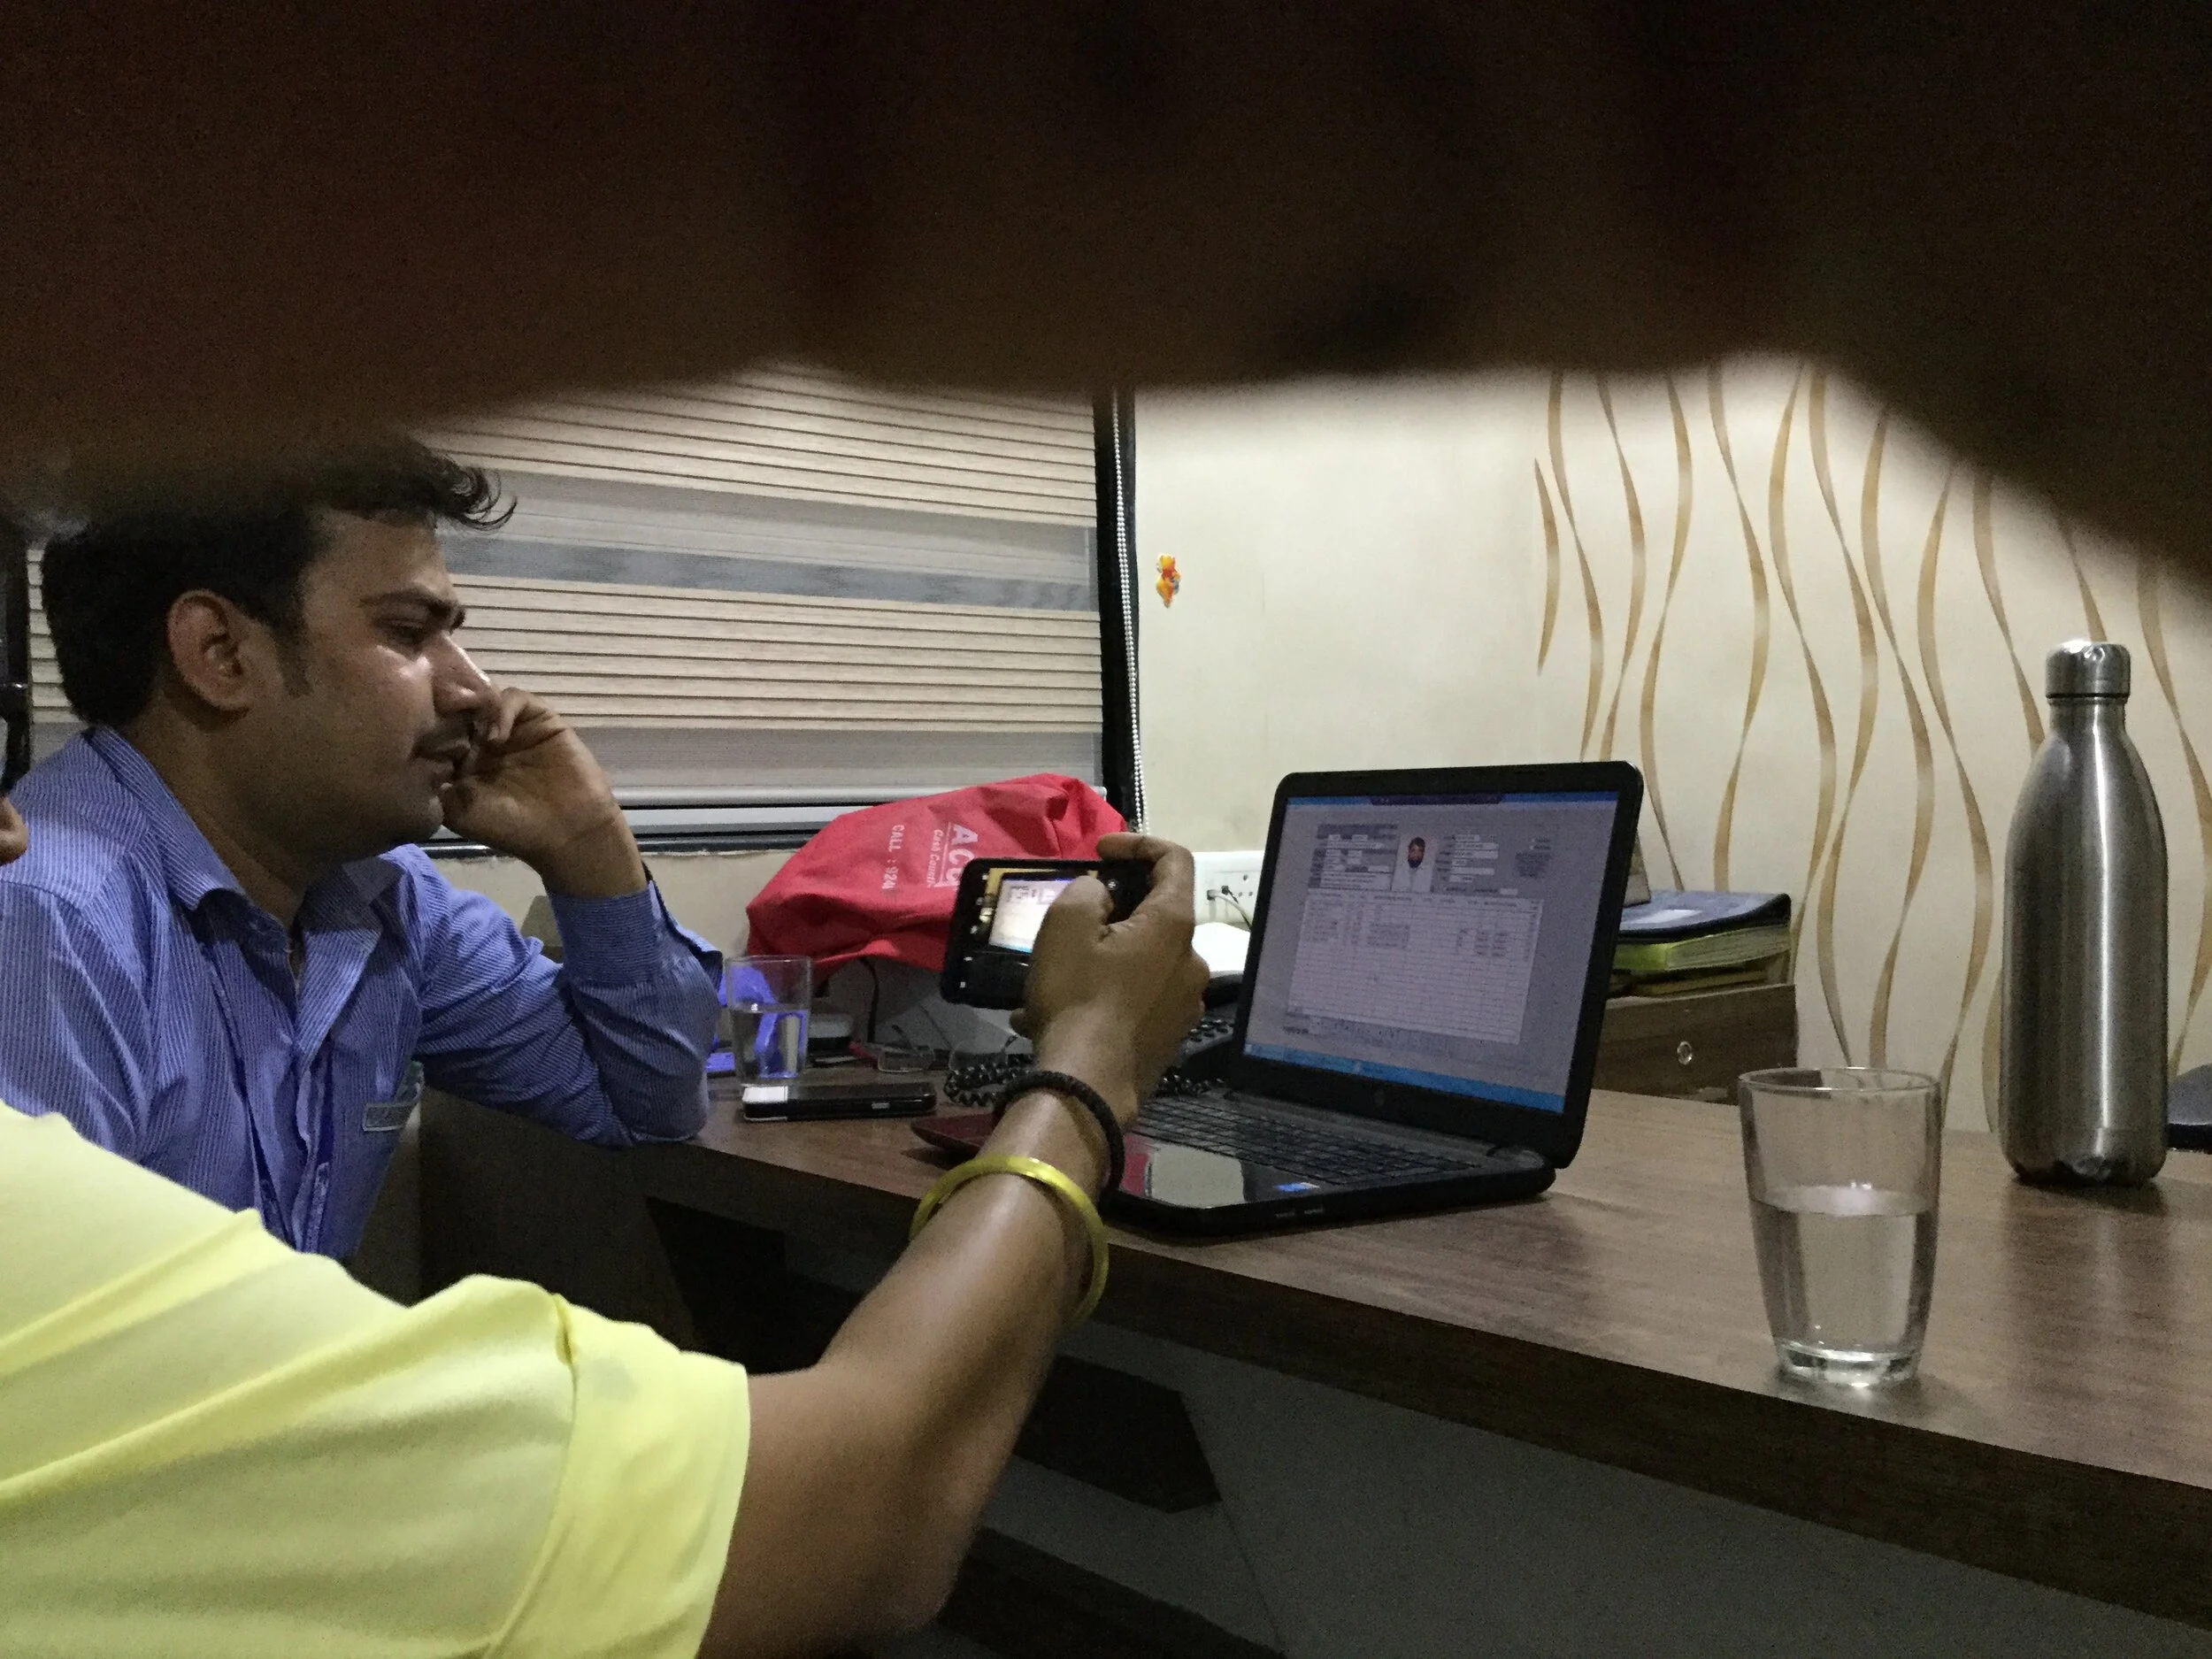
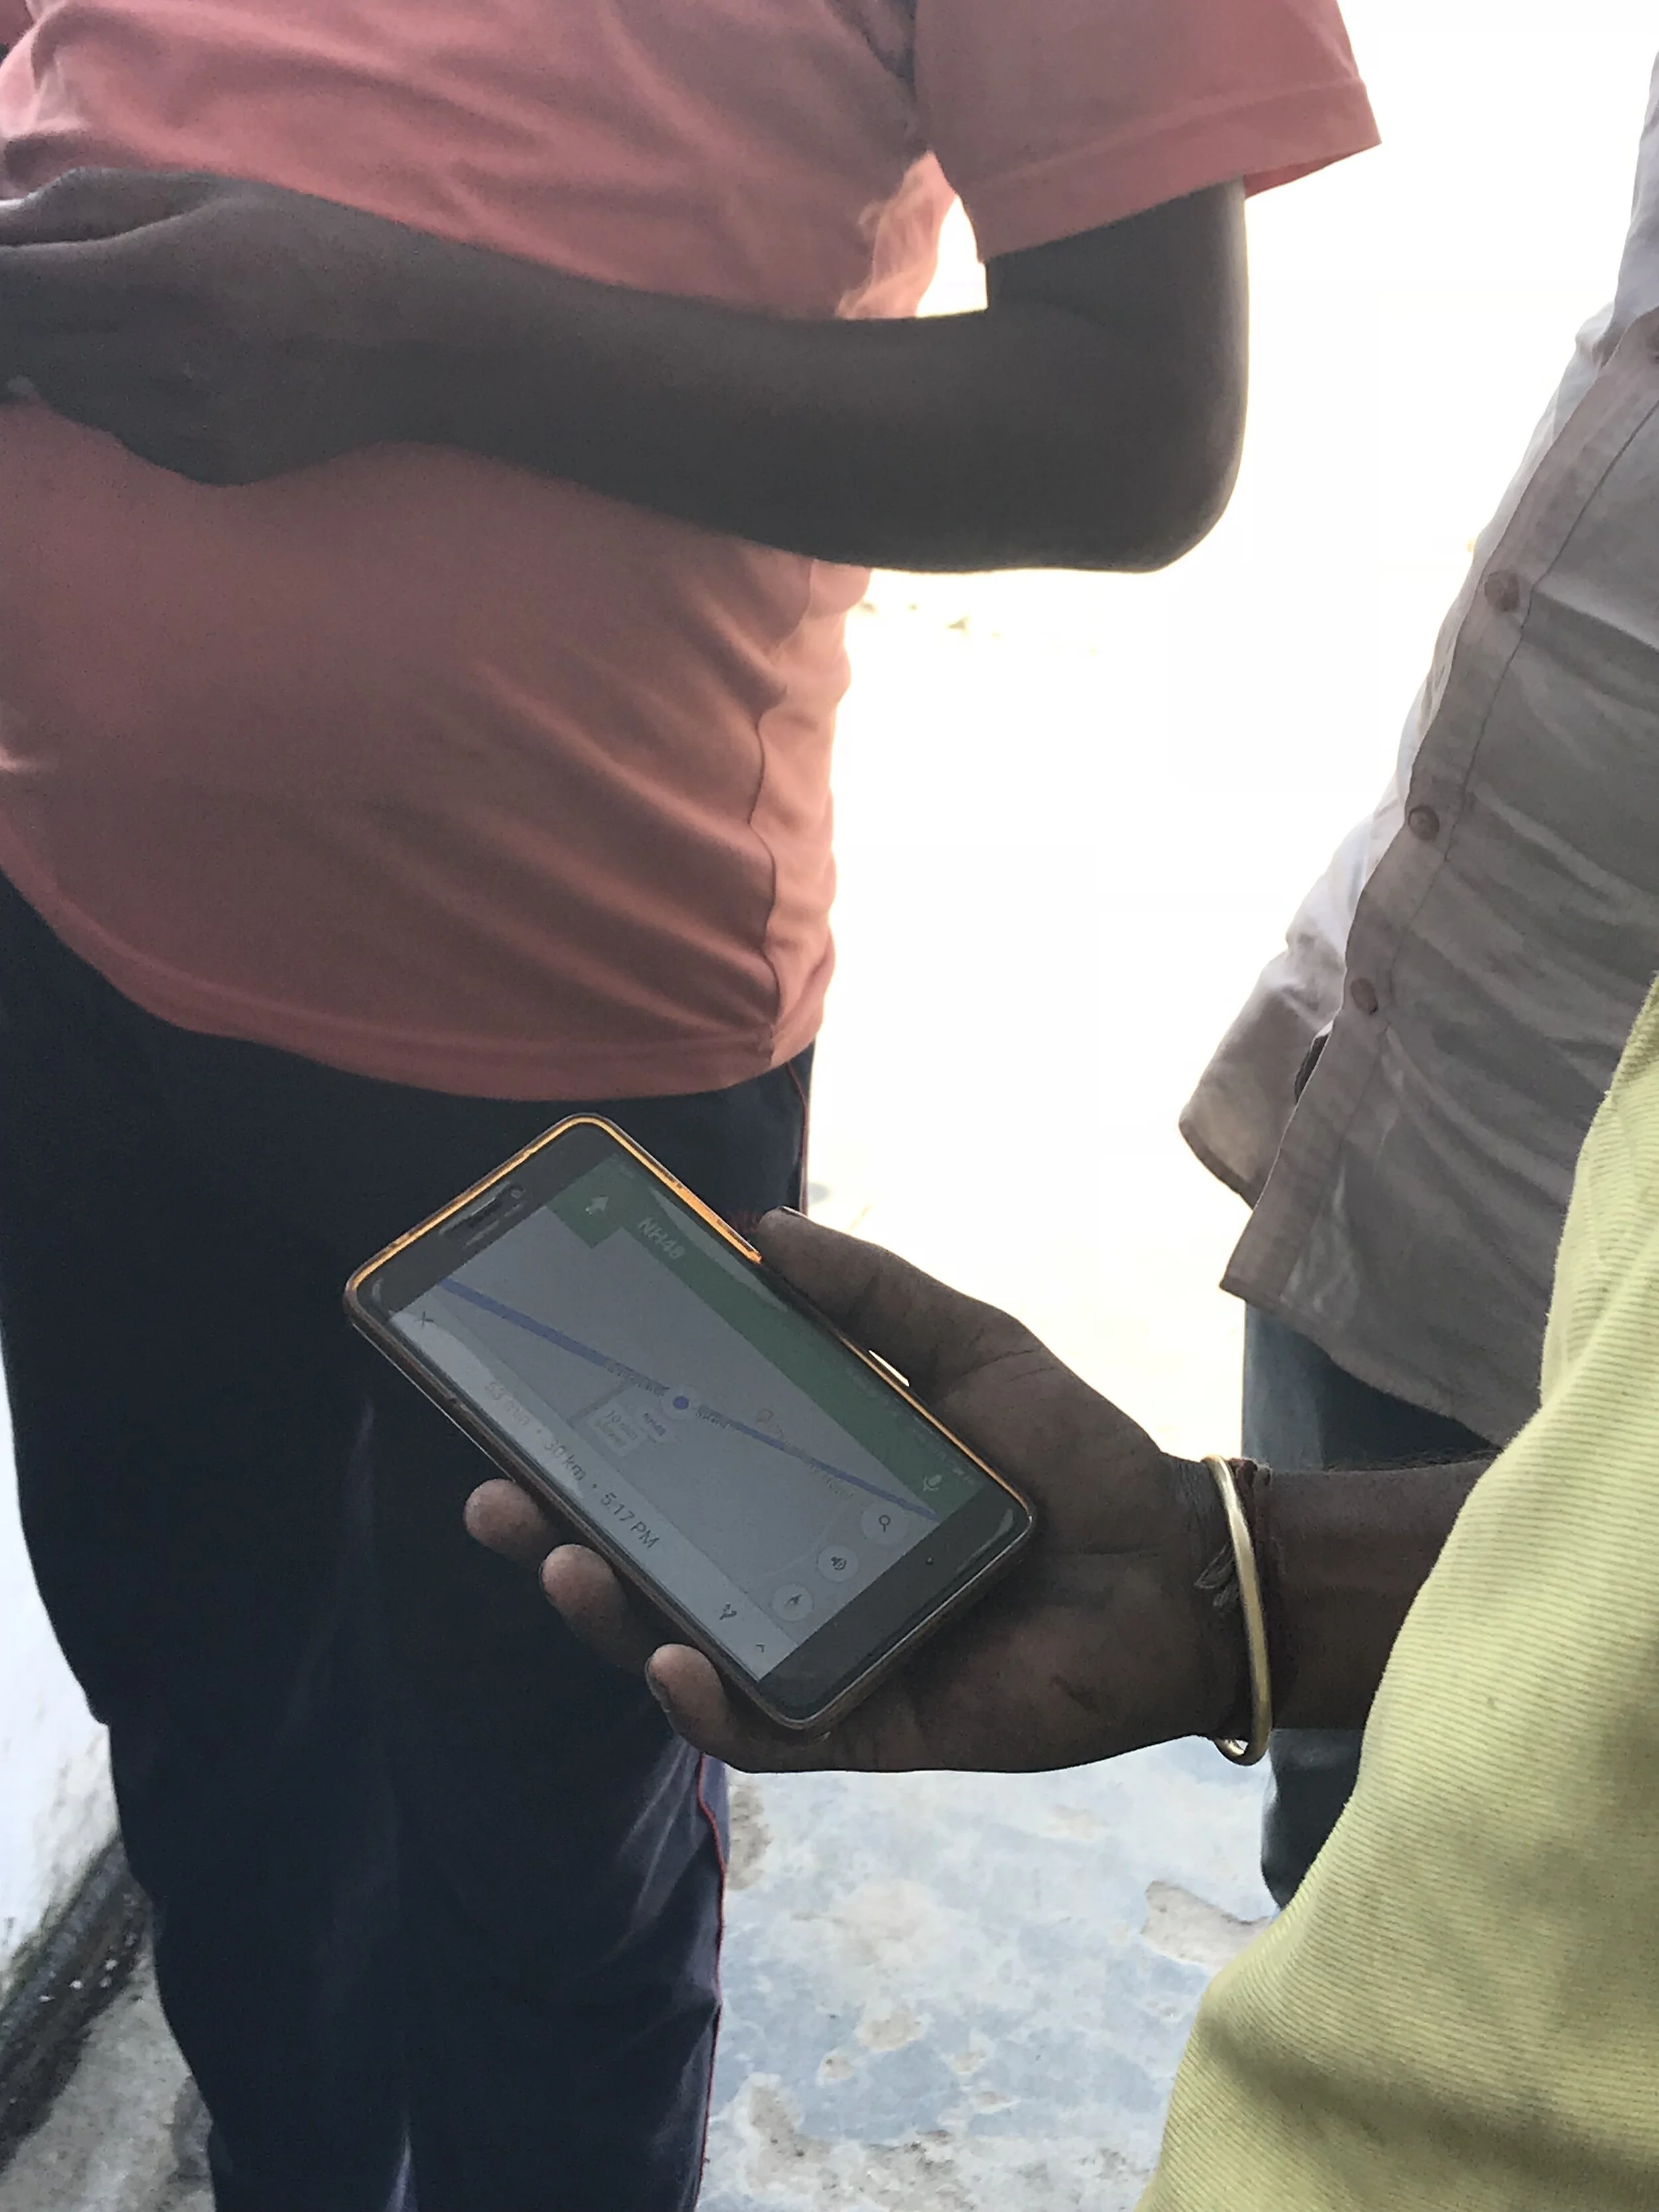


Understanding the Use of Tools: Shown below is a spectrum of analog and digital tools used in fleet management and the objectives of their use.

RESEARCH SYNTHESIS: STAKEHOLDER/ACTOR PROFILES
We synthesized our research into key actors, to highlight stakeholder goals, aspirations, frustrations, motivations, experience levers and discovered initial opportunity areas for digital service touchpoints.


RESEARCH SYNTHESIS : ANALYSING INSIGHTS
We insights were maintained and backed by verbatim quotes and after discussion with the research team were organised into 4 categories -
1. Fuel Costs and and Vehicle Costs . 2. Drivers
3. Managers/Supervisors 4. Fleet Owner

Big Picture Insights

Driver Insights

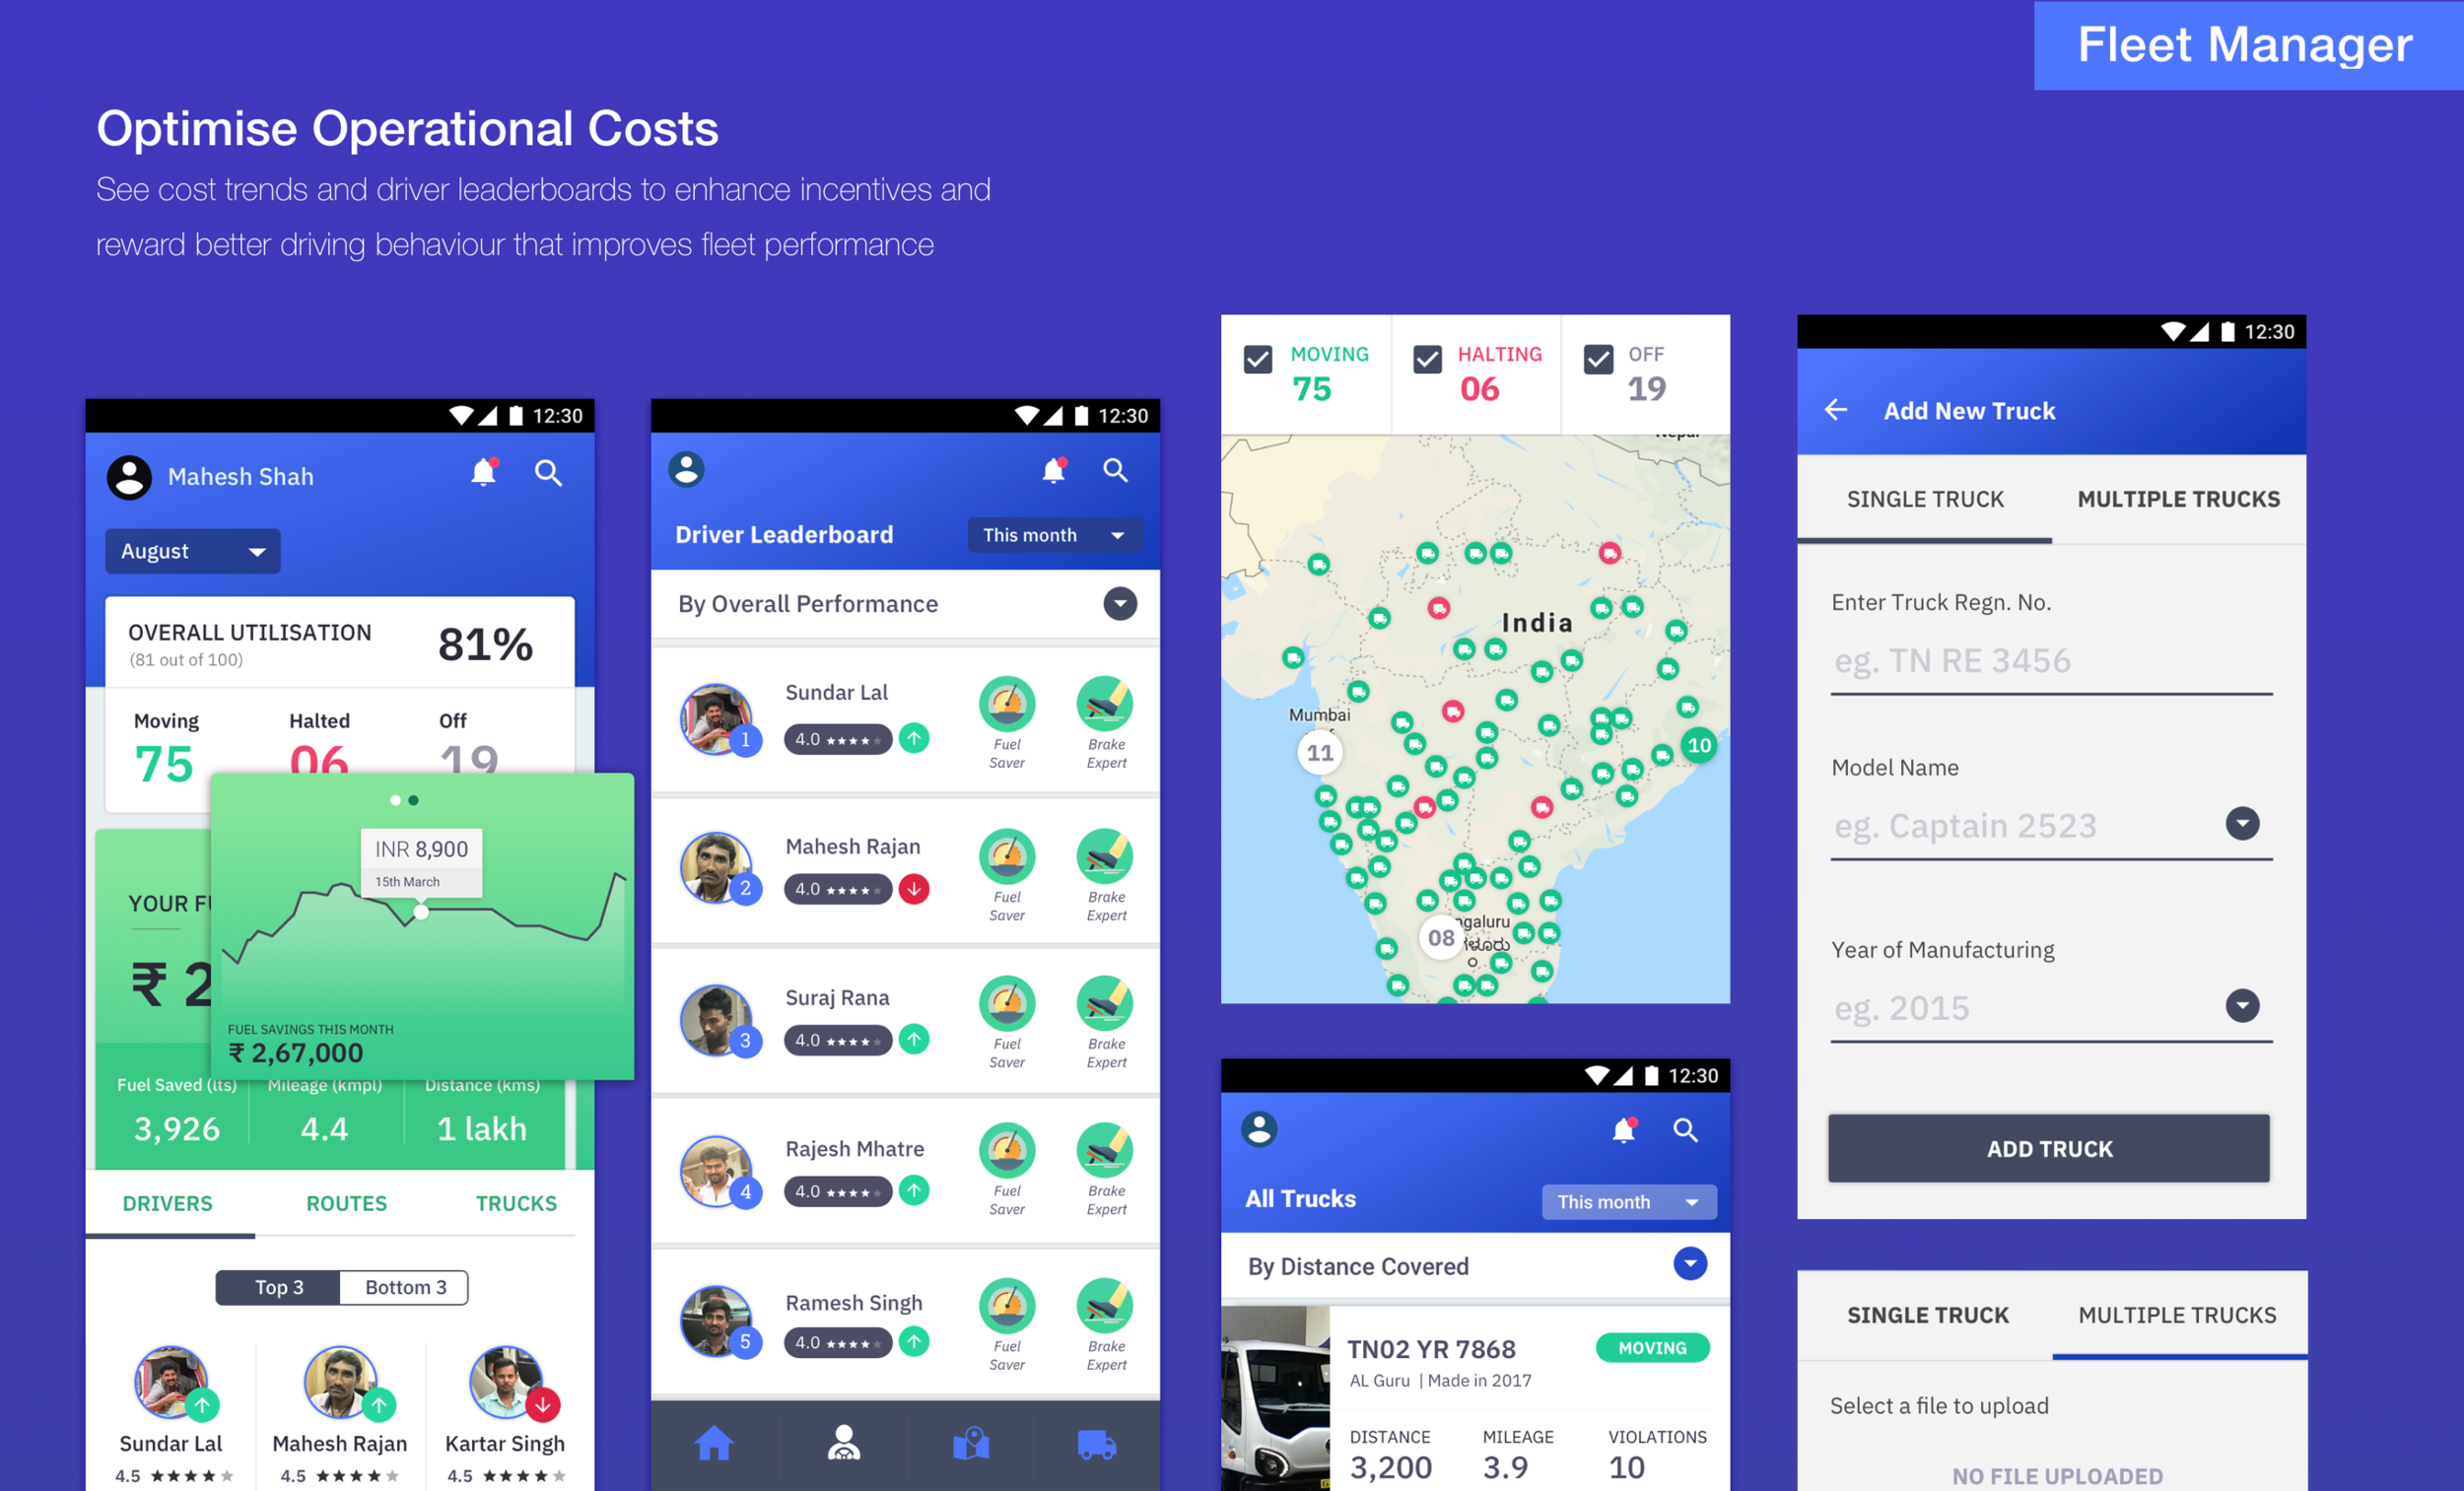
Insights about Fleet Managers

Insights about Fleet Owner and Business Operations
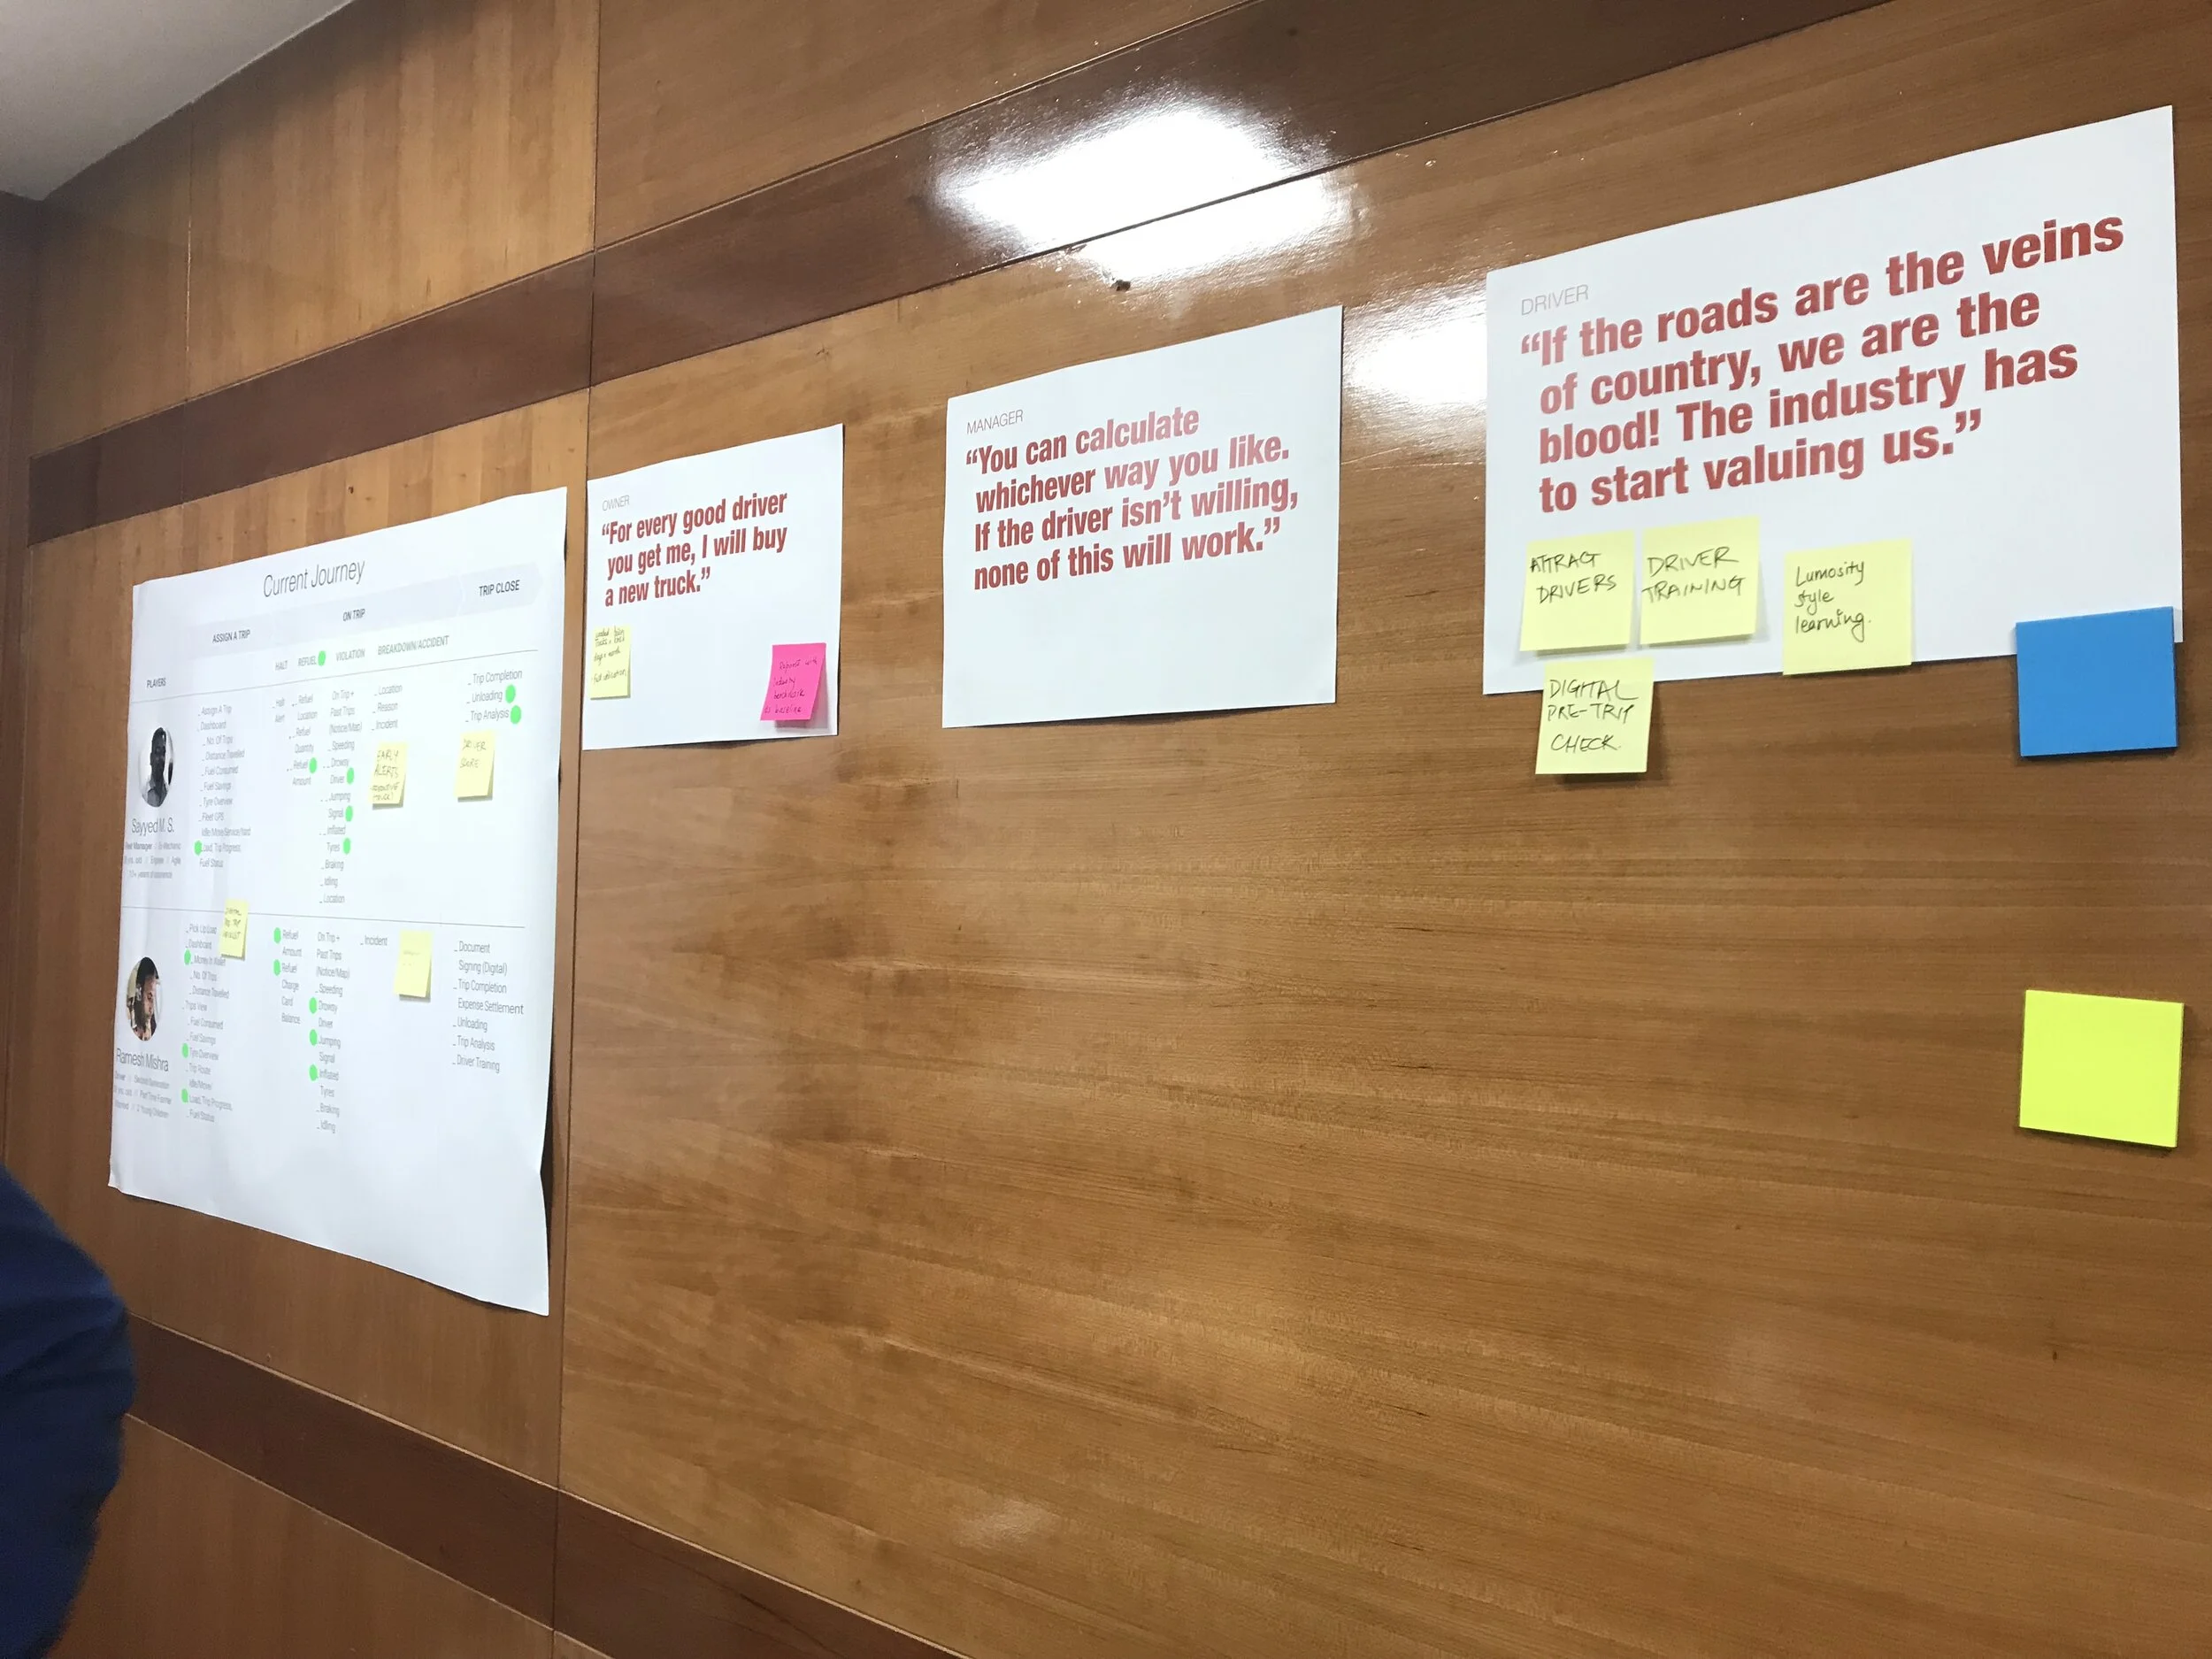
RESEARCH SYNTHESIS : EMERGING THEMES
After collated the qualitative data, key themes emerged. Themes relevant to the research objective and problem statement were prioritized to be presented as the voice of the stakeholder.

Journey Co-creation workshop with client stakeholders

Journey
The to-be journey of the product-service offering was detailed..
Prioritisation
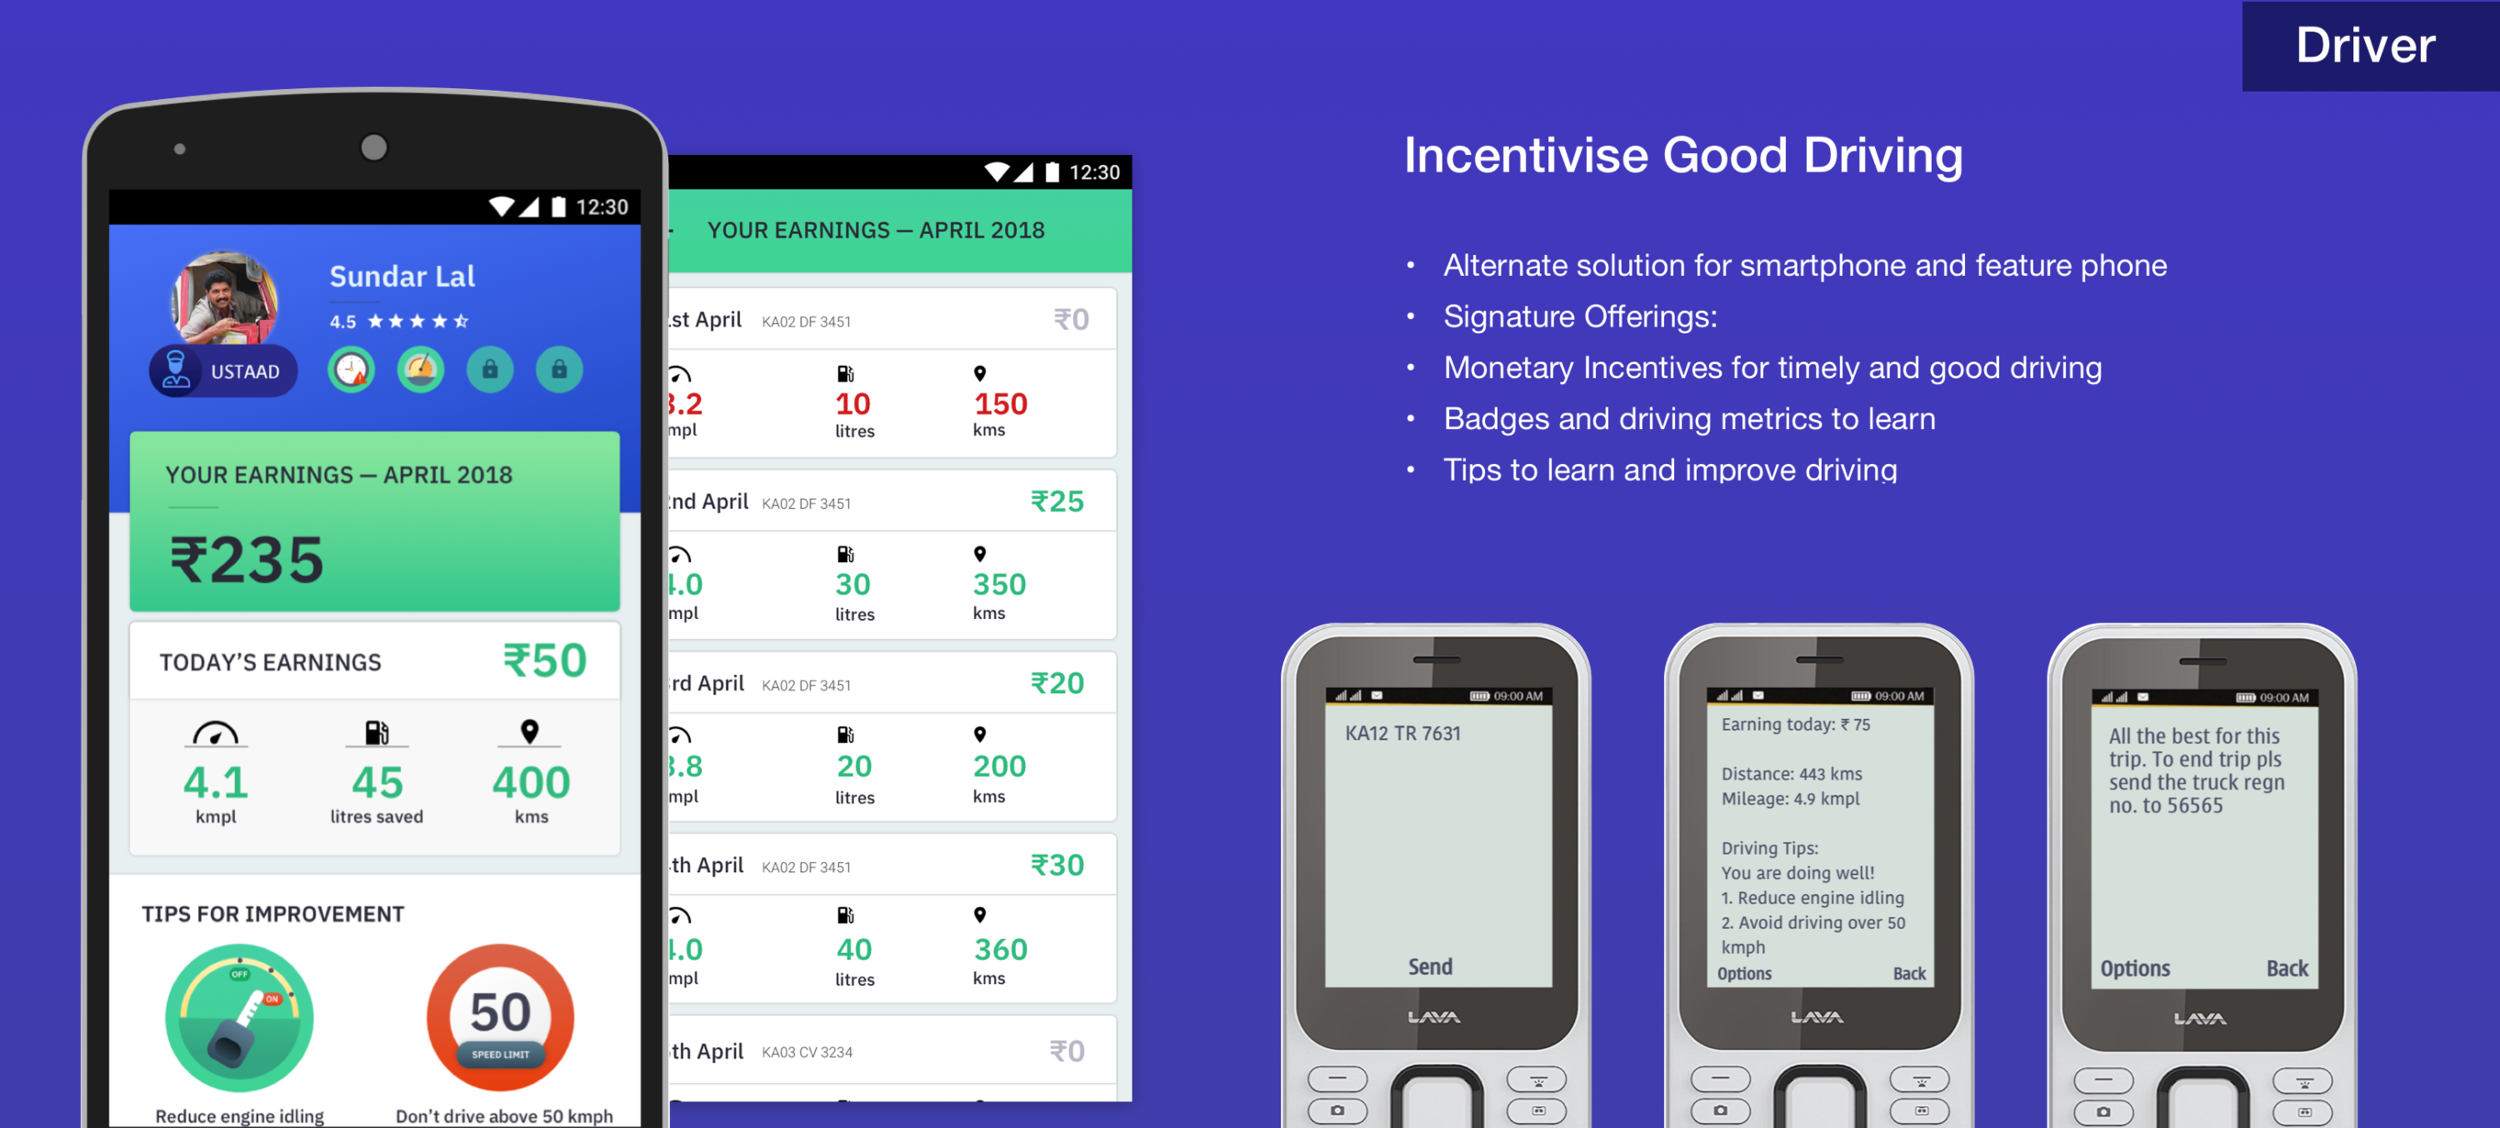
We prioritsed the signature offerings that would differentiate the experience from other competitors and tools.

MVP
Defining a viable, feasible and usable product to launch, was the outcome of the workshop.
OPPORTUNITY AREA FOR DESIGN
In the relatively unorganised trucking ecosystem of India, fleet managers incur large operating costs and yet drivers are under-compensated for the long hours of work and low incentive. Apart from estimates, there is no standardized way to measure fuel consumption and incentivize drivers for their work.
Digital Tools can be utilised for obtaining standard process and improve roas safety.
With better incentives, lifestyle, safety and training towards better driving practices, fuel efficiency is possible.

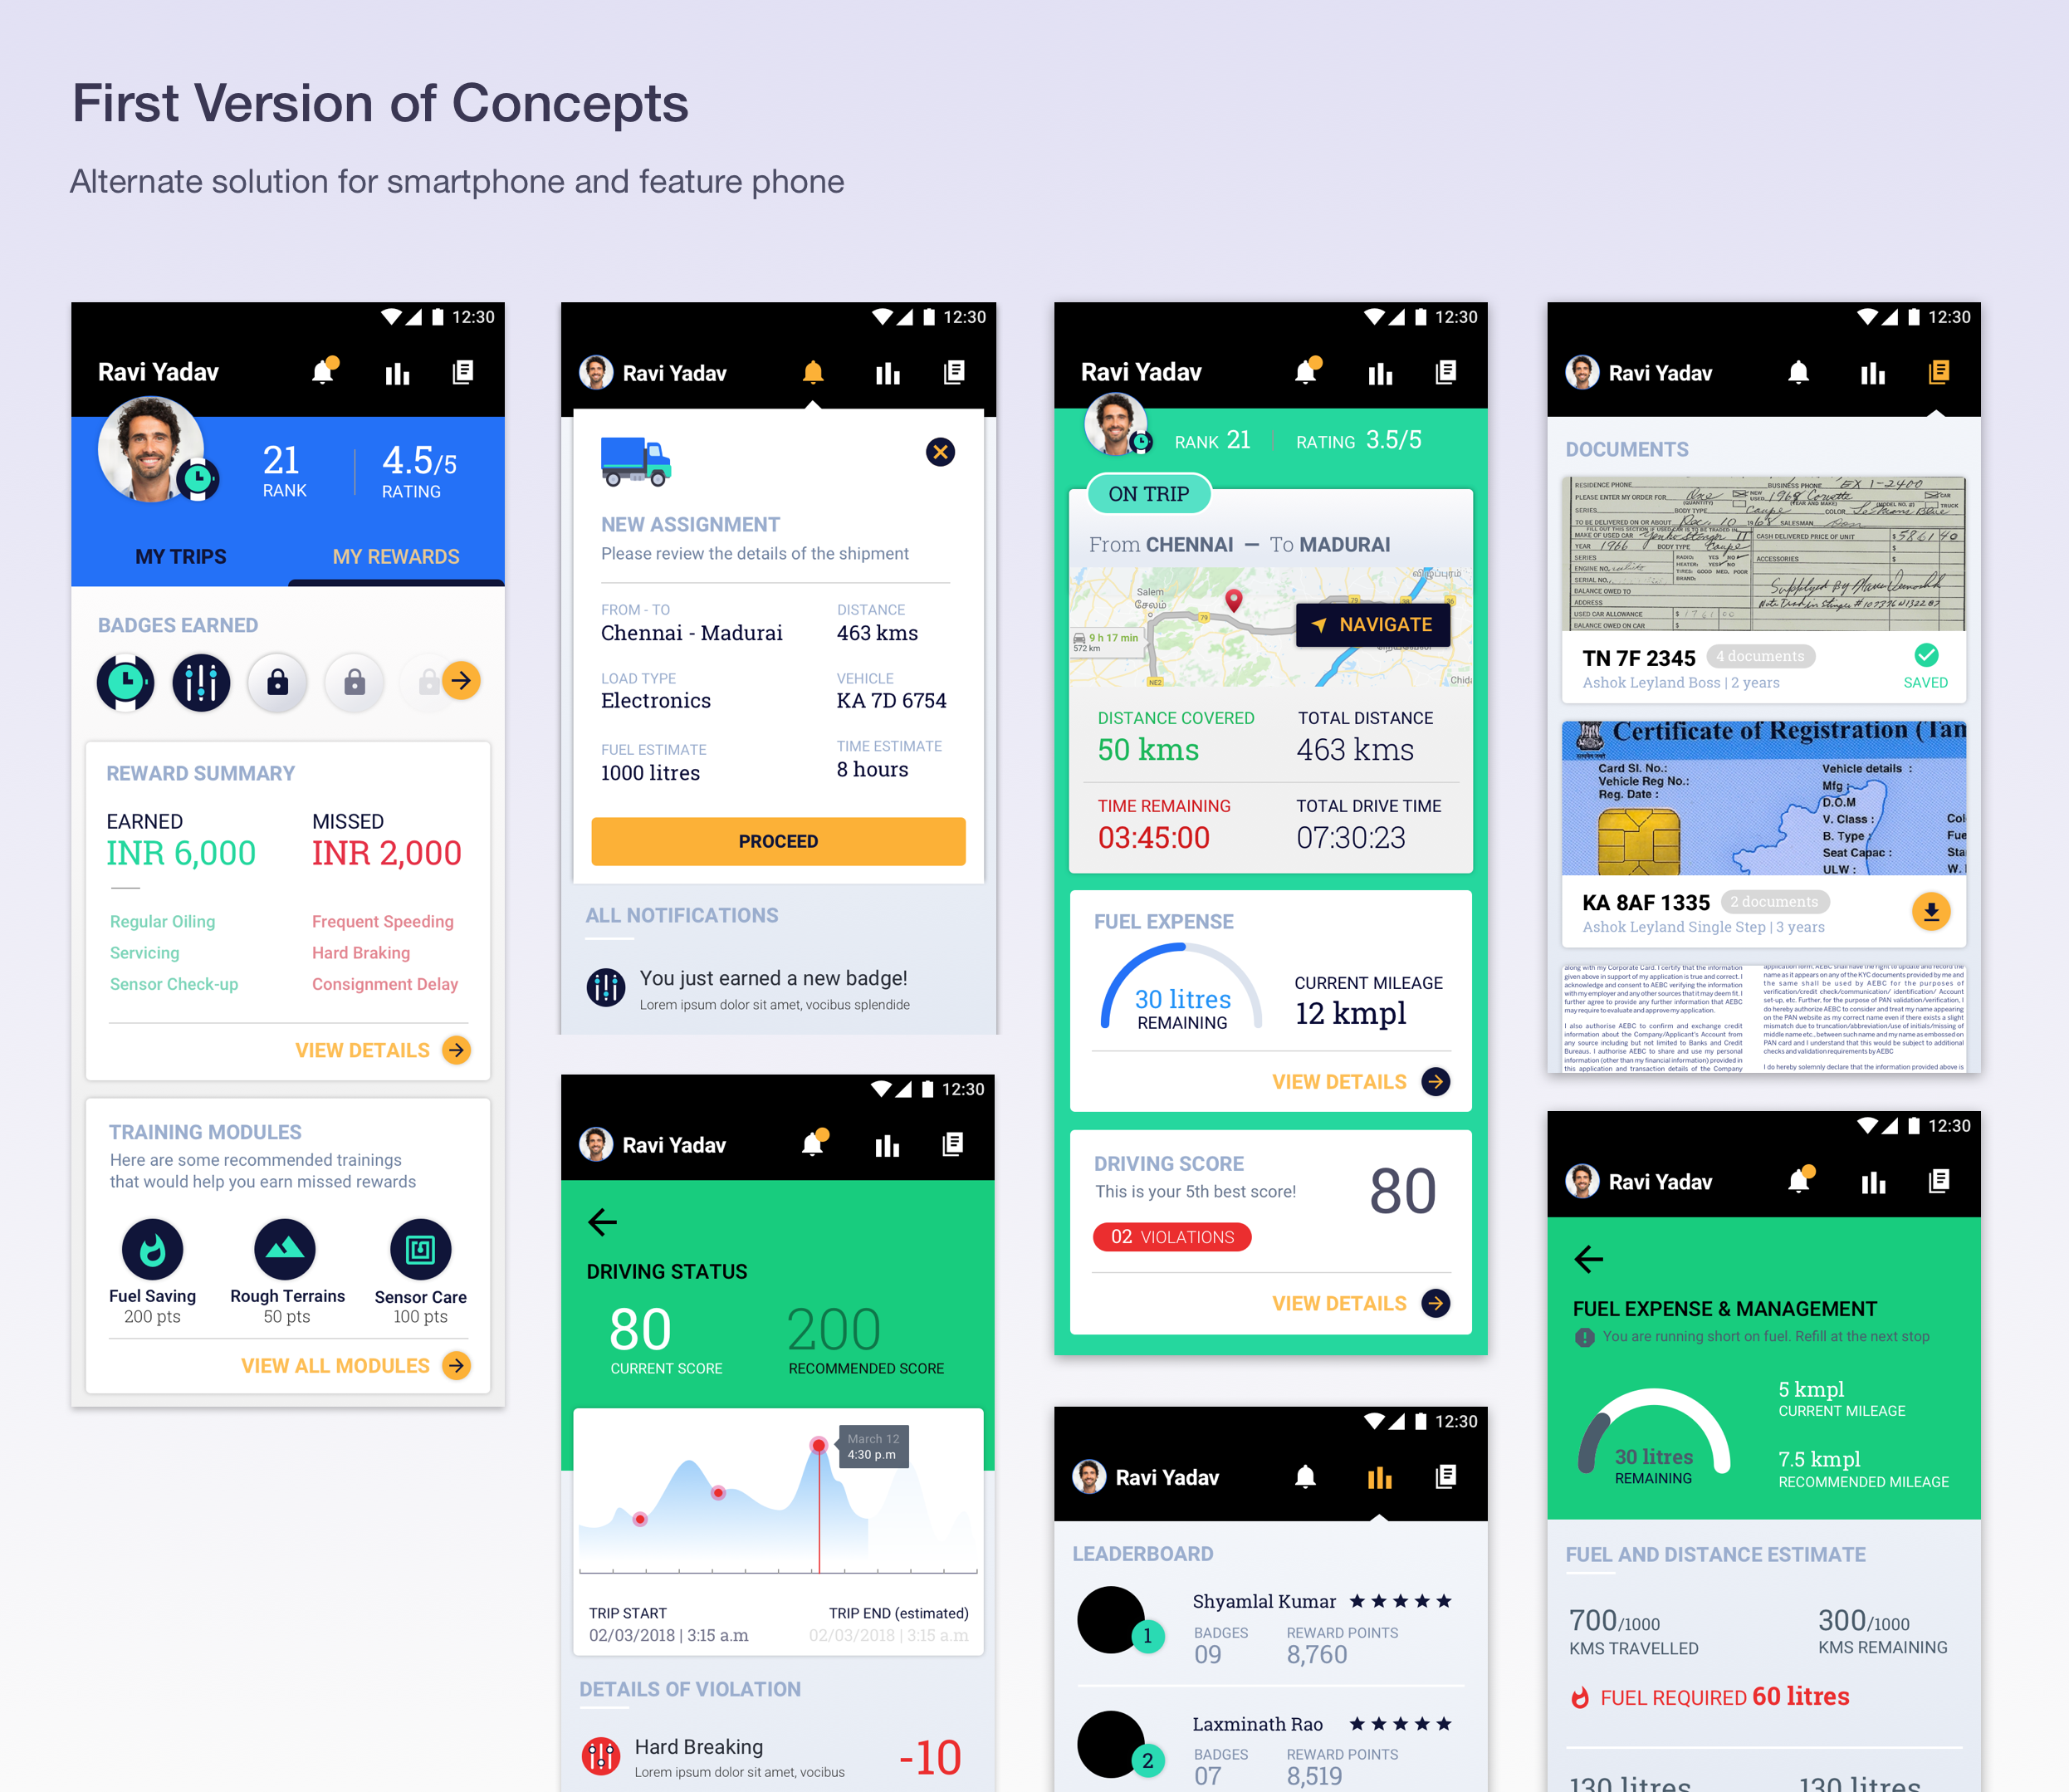
Iconography and Visual Systems
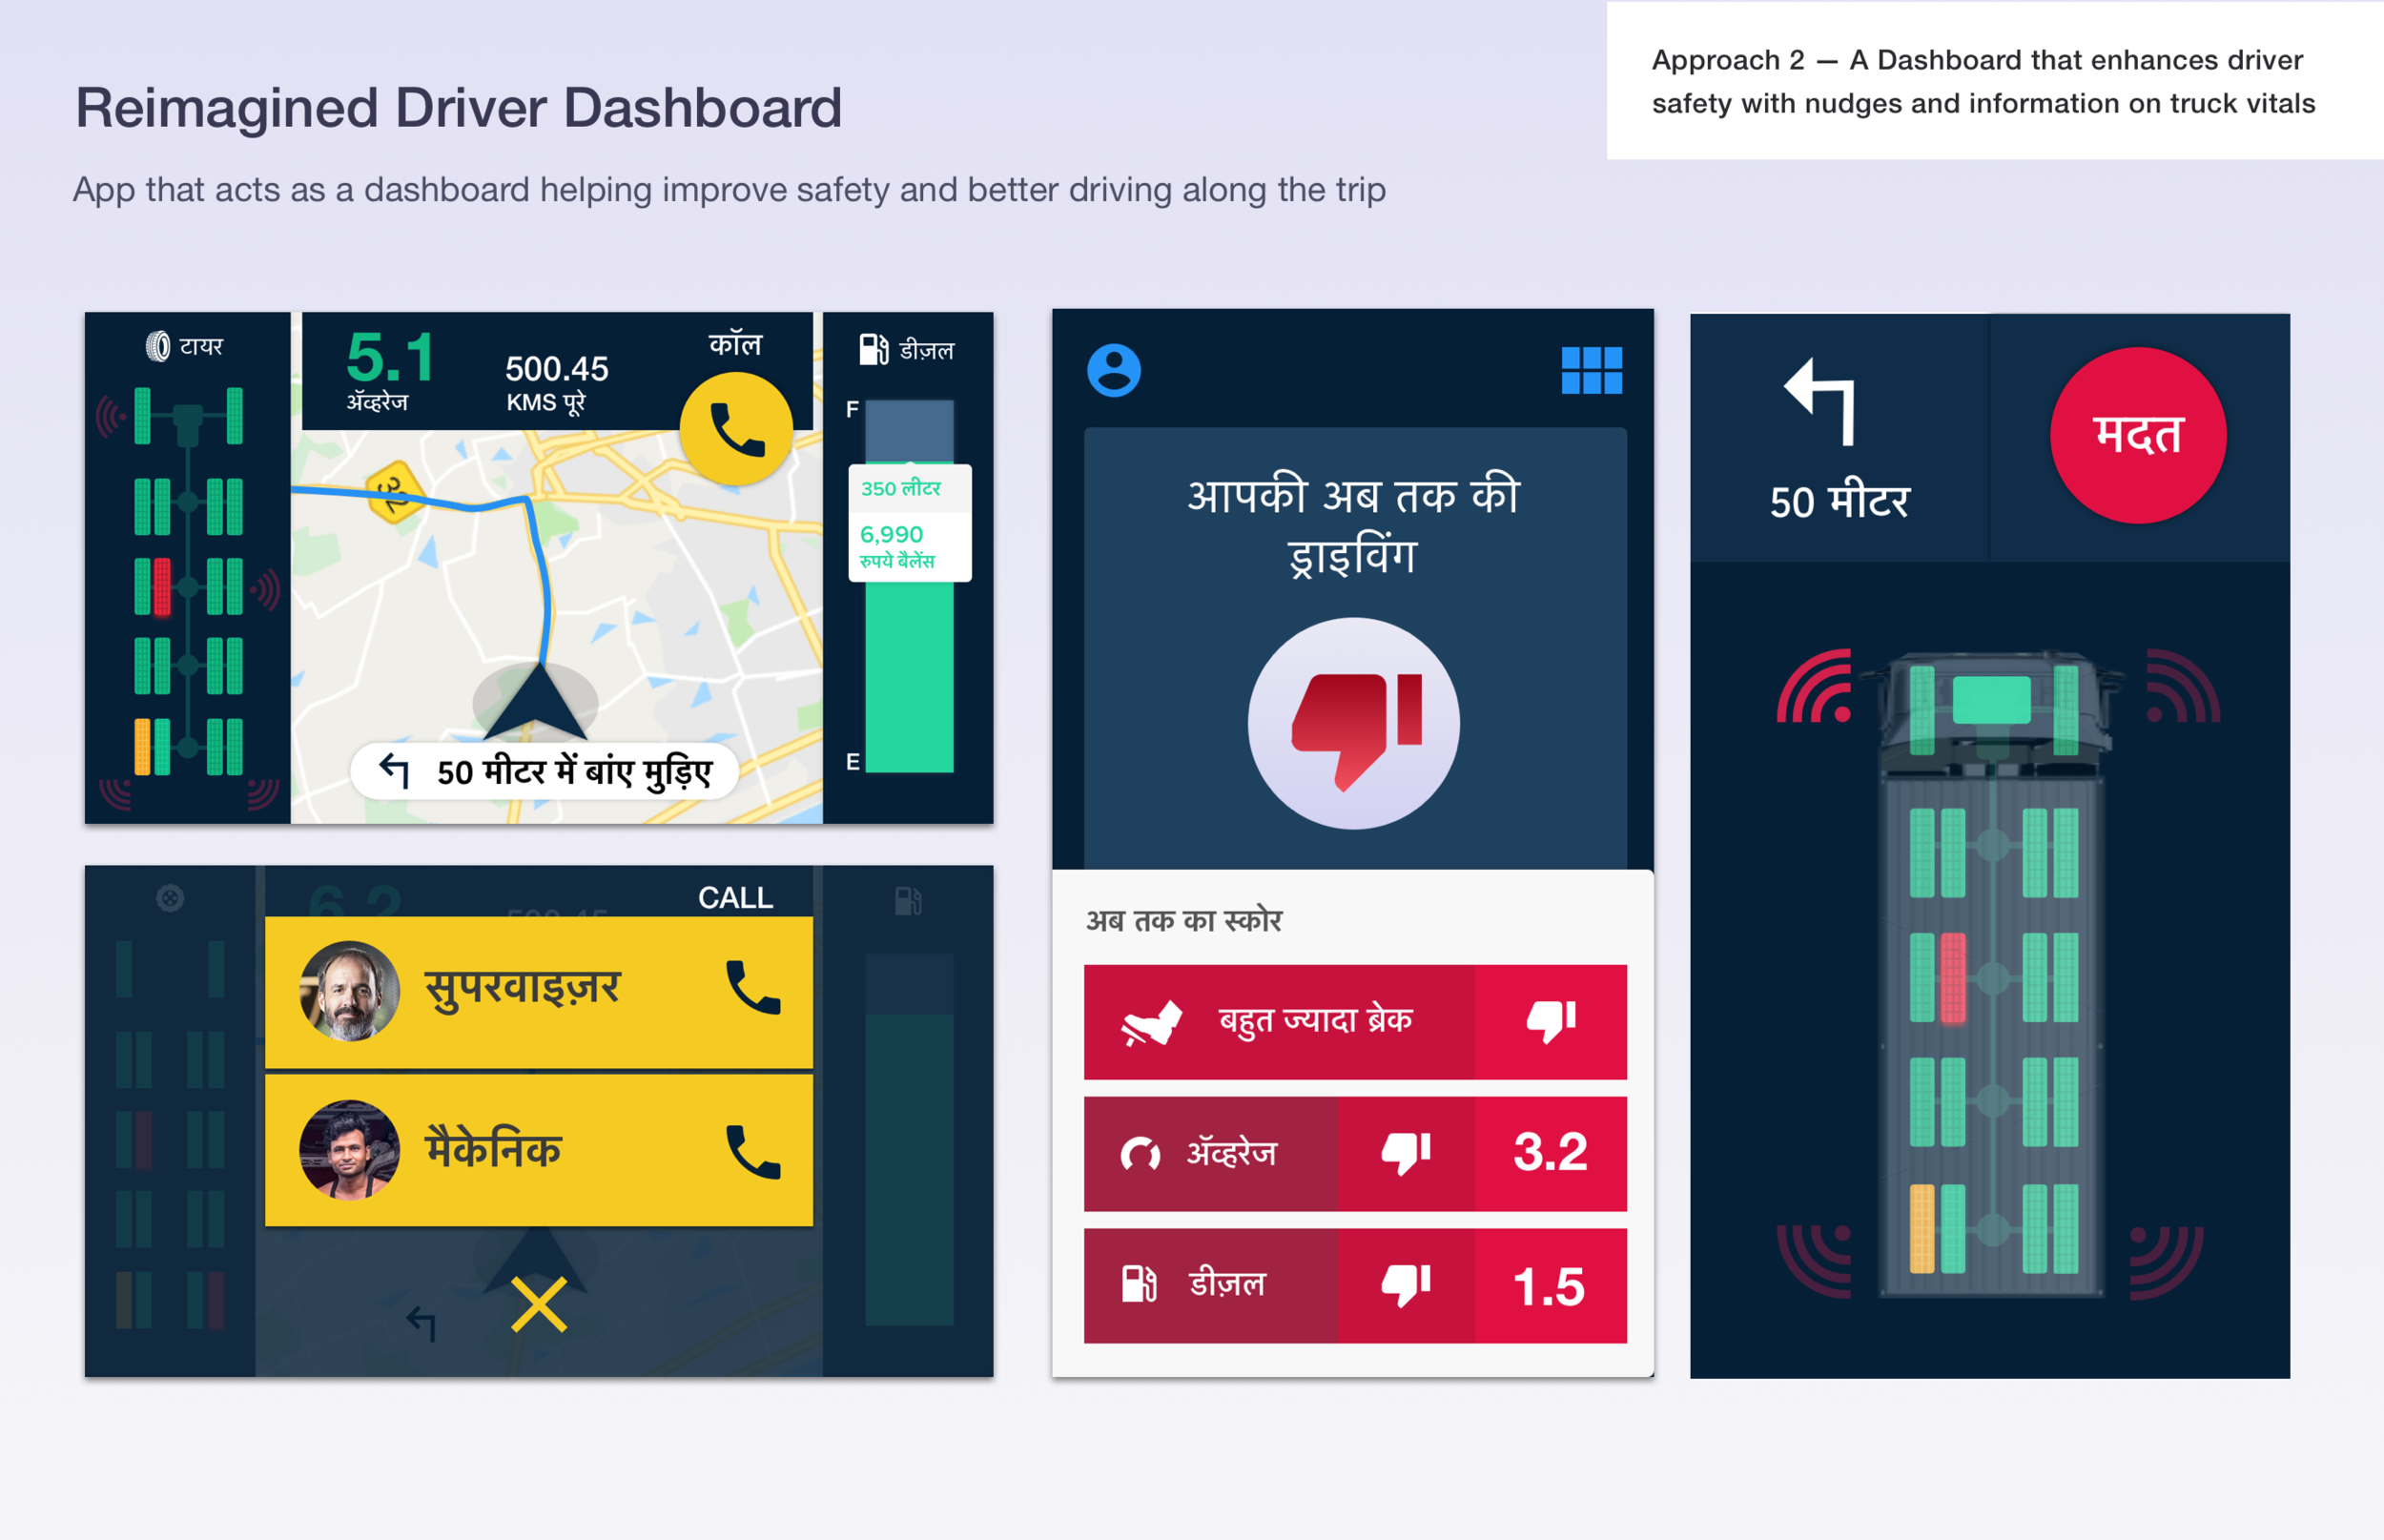

User Flow of the driver-side design interventionfor the proposed MVP